"In elementary algebra, a quadratic equation (from the Latin quadratus for "square") is any equation having the form
ax^2+bx+c=0
where x represents an unknown, and a, b, and c are constants with a not equal to 0. If a = 0, then the equation is linear, not quadratic. The constants a, b, and c are called, respectively, the quadratic coefficient, the linear coefficient and the constant or free term.
Because the quadratic equation involves only one unknown, it is called "univariate". The quadratic equation only contains powers of x that are non-negative integers, and therefore it is a polynomial equation, and in particular it is a second degree polynomial equation since the greatest power is two.
Quadratic equations can be solved by a process known in American English as factoring and in other varieties of English as factorising, by completing the square, by using the quadratic formula, or by graphing." [Quadratic equation. Wikipedia]
The flowchart example "Solving quadratic equation algorithm" was created using the ConceptDraw PRO diagramming and vector drawing software extended with the Mathematics solution from the Science and Education area of ConceptDraw Solution Park.
Solving quadratic equation flow chart

"In mathematics, the Euclidean algorithm, or Euclid's algorithm, is a method for computing the greatest common divisor (GCD) of two (usually positive) integers, also known as the greatest common factor (GCF) or highest common factor (HCF). ...
The GCD of two positive integers is the largest integer that divides both of them without leaving a remainder (the GCD of two integers in general is defined in a more subtle way).
In its simplest form, Euclid's algorithm starts with a pair of positive integers, and forms a new pair that consists of the smaller number and the difference between the larger and smaller numbers. The process repeats until the numbers in the pair are equal. That number then is the greatest common divisor of the original pair of integers.
The main principle is that the GCD does not change if the smaller number is subtracted from the larger number. ... Since the larger of the two numbers is reduced, repeating this process gives successively smaller numbers, so this repetition will necessarily stop sooner or later - when the numbers are equal (if the process is attempted once more, one of the numbers will become 0)." [Euclidean algorithm. Wikipedia]
The flowchart example "Euclidean algorithm" was created using the ConceptDraw PRO diagramming and vector drawing software extended with the Mathematics solution from the Science and Education area of ConceptDraw Solution Park.
Euclid's algorithm flow chart

Basic Flowchart Symbols and Meaning


Diagram Flow Chart

Types of Flowcharts


Flow Chart Design - How to Design a Good Flowchart

How to Discover Critical Path on a Gantt Chart

Flowchart Software

Creating a Simple Flowchart

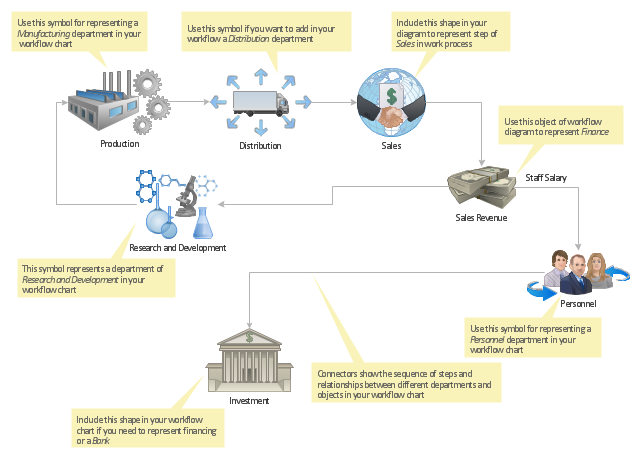
"Workflow components.
A workflow can usually be described using formal or informal flow diagramming techniques, showing directed flows between processing steps. Single processing steps or components of a workflow can basically be defined by three parameters:
(1) input description: the information, material and energy required to complete the step,
(2) transformation rules, algorithms, which may be carried out by associated human roles or machines, or a combination,
(3) output description: the information, material and energy produced by the step and provided as input to downstream steps.
Components can only be plugged together if the output of one previous (set of) component(s) is equal to the mandatory input requirements of the following component. Thus, the essential description of a component actually comprises only in- and output that are described fully in terms of data types and their meaning (semantics). The algorithms' or rules' description need only be included when there are several alternative ways to transform one type of input into one type of output – possibly with different accuracy, speed, etc.
When the components are non-local services that are invoked remotely via a computer network, such as Web services, additional descriptors (such as QoS and availability) also must be considered." [Workflow. Wikipedia]
The workflow diagram template for the ConceptDraw PRO diagramming and vector drawing software is included in the Workflow Diagrams solution from the Business Processes area of ConceptDraw Solution Park.
Workflow diagram template
Simple Flow Chart

Software development with ConceptDraw PRO

Samples of Flowcharting

Flow Chart

Flowchart design. Flowchart symbols, shapes, stencils and icons


- Flowchart And Algorithm
- Algorithm Flowchart Diagram
- Diagram Flow Chart | Selection sorting method - Algorithm flowchart ...
- Define Algorithms On Very General Basic Draw Flow Charts As
- Define Algorithm And Draw Flow Charts As Descriptive Algorithms
- Mathematics | Download Examples Of Euclulid Algorithms And ...
- Algorithm Flowchart Software Mac Freeware
- Solving quadratic equation algorithm - Flowchart
- Basic Flowchart Symbols and Meaning | Mcq On Algorithms And ...
- Diagram Flow Chart | Flow Chart for Olympic Sports | Selection ...
- Solving quadratic equation algorithm - Flowchart | Basic Flowchart ...
- Algorithms Flow Chart Pictures
- Euclidean algorithm - Flowchart | Flow Chart To Elaborate And ...
- Algorithm flowchart - Selection sorting method | Selection sorting ...
- Characteristics Of Algorithm And Flowchart
- Algorithms And Flow Chart Videos Free Download
- Euclidean algorithm - Flowchart | Flow Chart To Eloborate And ...
- Algorithms Are The Base Of All Computer Programs Make A ...
- Define Algorithms On Very General Basics Draw Flow Charts As