Flowchart design. Flowchart symbols, shapes, stencils and icons


AWS Simple Icons for Architecture Diagrams

The vector stencils library "Scrum workspace" contains 21 icons.
Use this clipart set to design your agile software development diagrams and infographics with ConceptDraw PRO software.
"... a list of all the things that ... should be visible within the ideal agile workspace:
Big Visible Charts. ... the sprint burndown chart, showing the number of hours remaining as of each day of the current sprint. ... big visible charts showing the number of passing customer acceptance tests, the pass/ fail status of tests by day, sprint and release burndown charts, number of new stories introduced to the product backlog per sprint, and more.
Additional feedback devices. In addition to big, visible charts, it is common for an agile team to use additional visual feedback devices in their workspace. One of the most common is a lava lamp that is turned on whenever the automated build is broken.
... flashing red traffic lights to indicate exceptional conditions such as an issue on a production server. Also popular are ambient orbs and Nabaztag rabbits, which are wireless programmable devices that can also be configured to change colors, speak messages, or wiggle their ears as a team desires. ...
Everyone on your team. Each person on the team should ideally be able to see each other person on the team. This absolutely includes the ScrumMaster and ideally includes the product owner. ...
The sprint backlog. One of the best ways to ensure that everything necessary is completed in the sprint is to make the sprint backlog visible. The best way to do that is by displaying the sprint backlog on a wall, ideally in the form of a task board ...
The product backlog. One problem with running an endless series of sprints is that each can feel disconnected or isolated from the whole of a planned released or related set of new capabilities. A good way to reduce the impact of this problem is by displaying the product backlog somewhere clearly visible. ... tack the index cards with those upcoming user stories on a wall where all can see them. This allows team members to see how the user stories they are working on in the current sprint relate to others that are coming soon.
At least one big white board. ... Locating this in the team’s common workspace encourages spontaneous meetings." [mountaingoatsoftware.com/ blog/ the-ideal-agile-workspace]
The clip art sample "Design elements - Scrum workspace" is included in the Scrum solution from the Project Management area of ConceptDraw Solution Park.
Icon set
Pyramid Diagram

Cisco WAN. Cisco icons, shapes, stencils and symbols
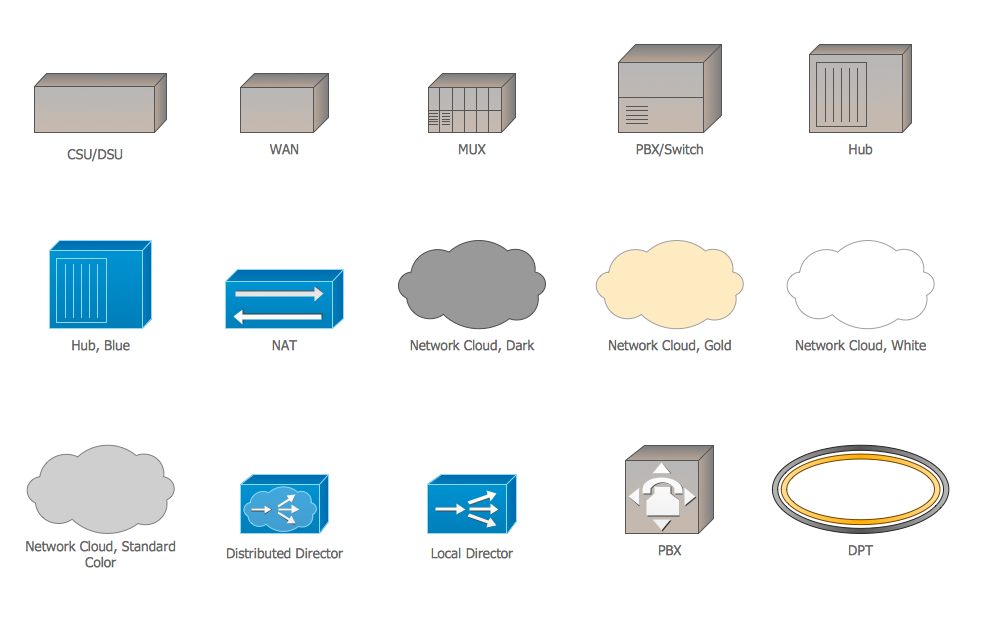
The vector stencils library "Cybersecurity round icons" contains 150 network security diagram icons.
Use it to design your computer security diagrams and cybersecurity infographics with ConceptDraw PRO software.
"A computer network diagram is a schematic depicting the nodes and connections amongst nodes in a computer network or, more generally, any telecommunications network. ...
Readily identifiable icons are used to depict common network appliances e.g. Router, and the style of lines between them indicate the type of connection. Clouds are used to represent networks external to the one pictured for the purposes of depicting connections between internal and external devices, without indicating the specifics of the outside network." [Computer network diagram. Wikipedia]
The pictograms example "Design elements - Cybersecurity round icons" is included in the Network Security Diagrams solution from the Computer and Networks area of ConceptDraw Solution Park.
Network security pictograms
Cisco Network Topology. Cisco icons, shapes, stencils and symbols

 iPhone User Interface
iPhone User Interface solution extends ConceptDraw DIAGRAM software with templates, samples and libraries with large quantity of vector stencils of graphical user interface elements, Apps icons, UI patterns for designing and prototyping of the iOS applic
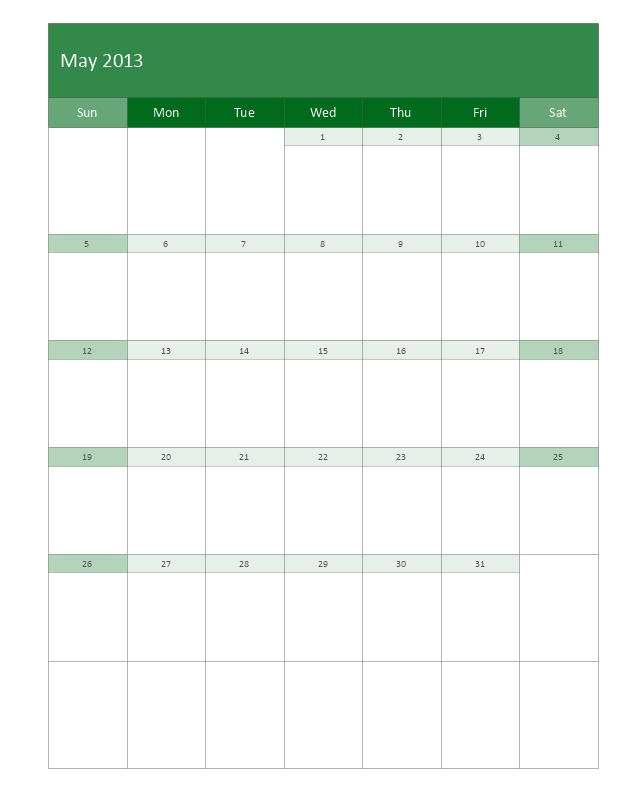
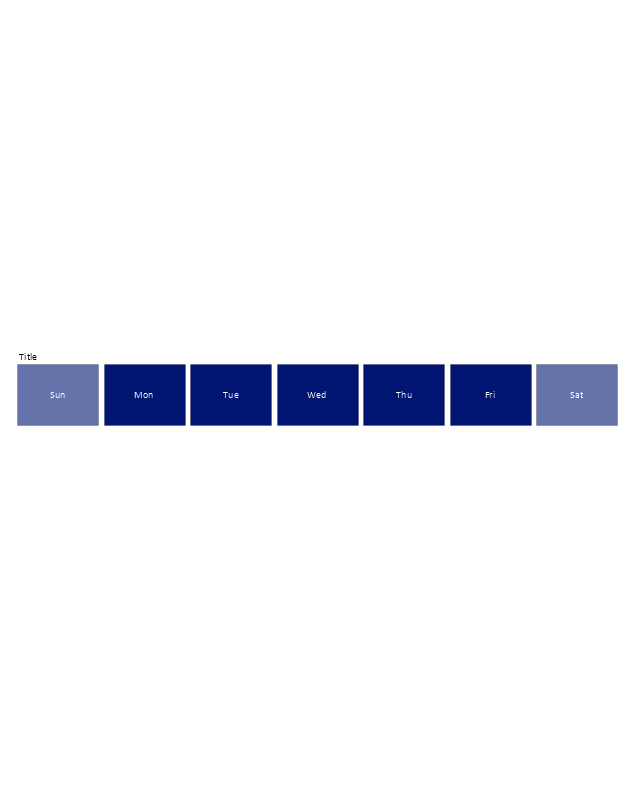
The vector stencils library "Calendars" contains 44 shapes of month calendars, marker icons and symbols for schedules, and clocks. Use it to create your calendars in the ConceptDraw PRO diagramming and vector drawing software extended with the Calendars solution from the Management area of ConceptDraw Solution Park.
Small Calendar (White, Rounded)
-calendars---vector-stencils-library.png--diagram-flowchart-example.png)
Small Calendar (White)
-calendars---vector-stencils-library.png--diagram-flowchart-example.png)
Small Calendar (Black, Rounded)
-calendars---vector-stencils-library.png--diagram-flowchart-example.png)
Small Calendar (Black)
-calendars---vector-stencils-library.png--diagram-flowchart-example.png)
Small Calendar (Color, Rounded)
-calendars---vector-stencils-library.png--diagram-flowchart-example.png)
Small Calendar (Color)
-calendars---vector-stencils-library.png--diagram-flowchart-example.png)
Mid Calendar (Rounded)
-calendars---vector-stencils-library.png--diagram-flowchart-example.png)
Mid Calendar
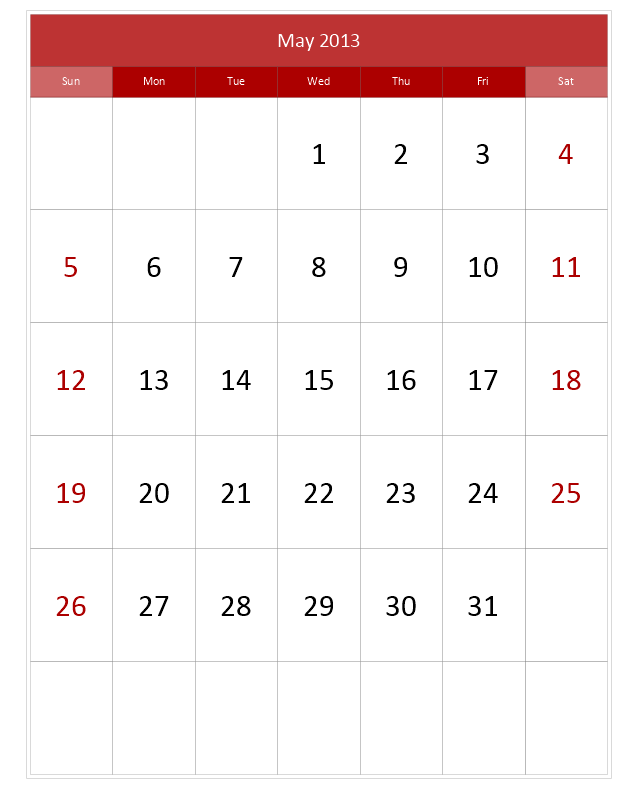
Large Calendar (Picture 1)
-calendars---vector-stencils-library.png--diagram-flowchart-example.png)
Large Calendar (Picture 2)
-calendars---vector-stencils-library.png--diagram-flowchart-example.png)
Large Calendar (Color)
-calendars---vector-stencils-library.png--diagram-flowchart-example.png)
Large Calendar
Large Calendar (Rounded)
-calendars---vector-stencils-library.png--diagram-flowchart-example.png)
Stylish Clocks

Clocks

Clocks

Week (First Letters)
-calendars---vector-stencils-library.png--diagram-flowchart-example.png)
Week
7 days
7 days
Month

Weeks

Quarter
3 Month

Special Day (Circle)
-calendars---vector-stencils-library.png--diagram-flowchart-example.png)
Special Day (Square)
-calendars---vector-stencils-library.png--diagram-flowchart-example.png)
Special Day (Triangle)
-calendars---vector-stencils-library.png--diagram-flowchart-example.png)
Special Day (Star)
-calendars---vector-stencils-library.png--diagram-flowchart-example.png)
Special Day (Cross)
-calendars---vector-stencils-library.png--diagram-flowchart-example.png)
Special Day (Check)
-calendars---vector-stencils-library.png--diagram-flowchart-example.png)
Special Day (Clocks)
-calendars---vector-stencils-library.png--diagram-flowchart-example.png)
Special Day (Note)
-calendars---vector-stencils-library.png--diagram-flowchart-example.png)
Special Day (Lightning)
-calendars---vector-stencils-library.png--diagram-flowchart-example.png)
Special Day (Heart)
-calendars---vector-stencils-library.png--diagram-flowchart-example.png)
:)
-calendars---vector-stencils-library.png--diagram-flowchart-example.png)
:(

Moon phase, new

Moon phase, waxing crescent

Moon phase, 1st quarter
Moon phase, waxing gibbous

Moon phase, full

Moon phase, waning gibbous

Moon phase, 3rd quarter

Moon phase, waning crescent

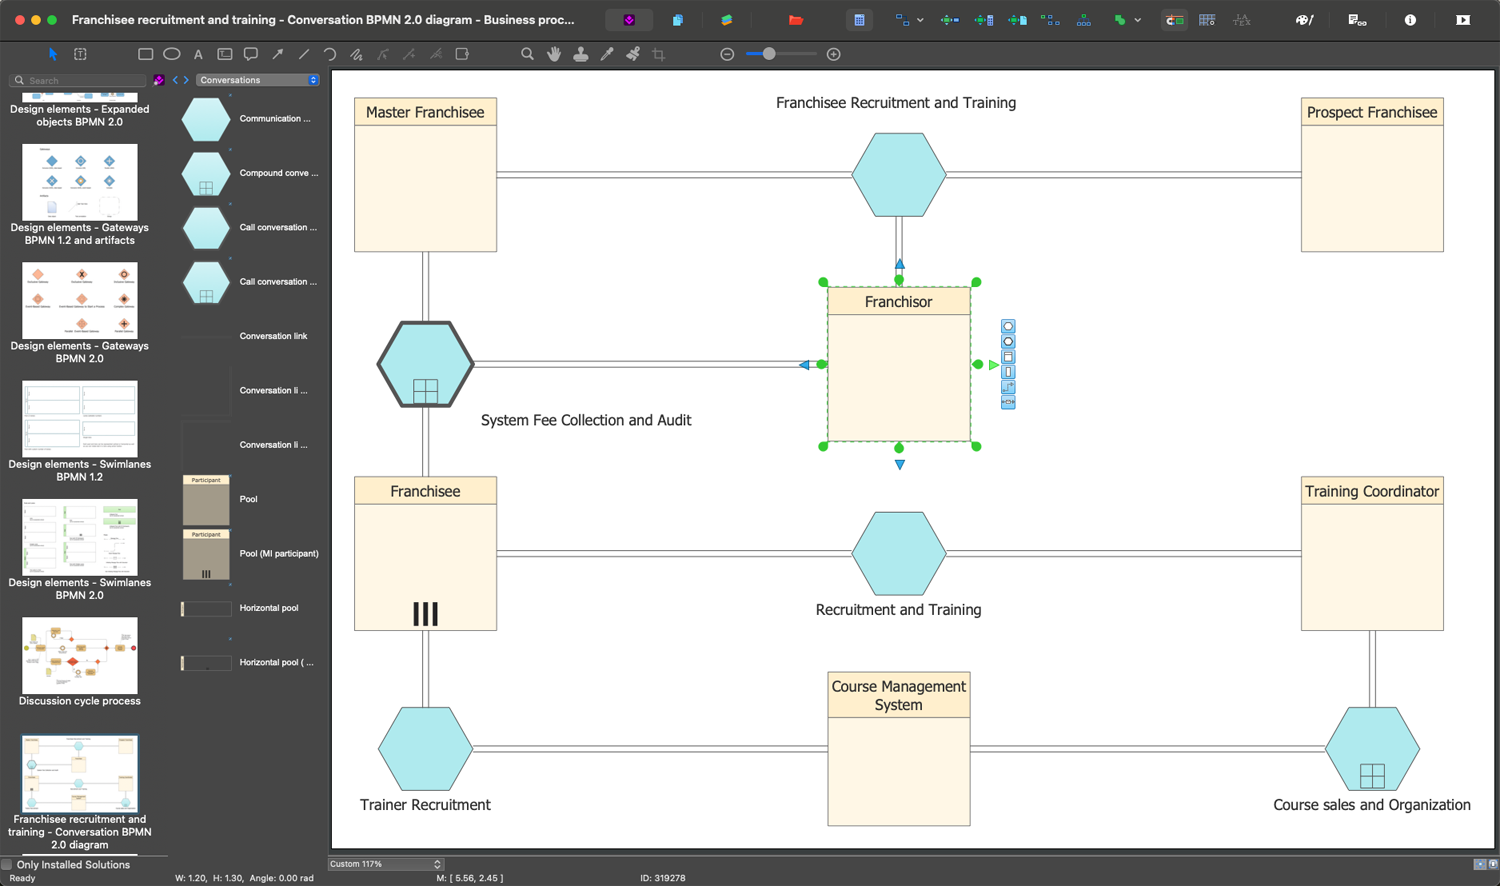
The Best Business Process Modeling Software

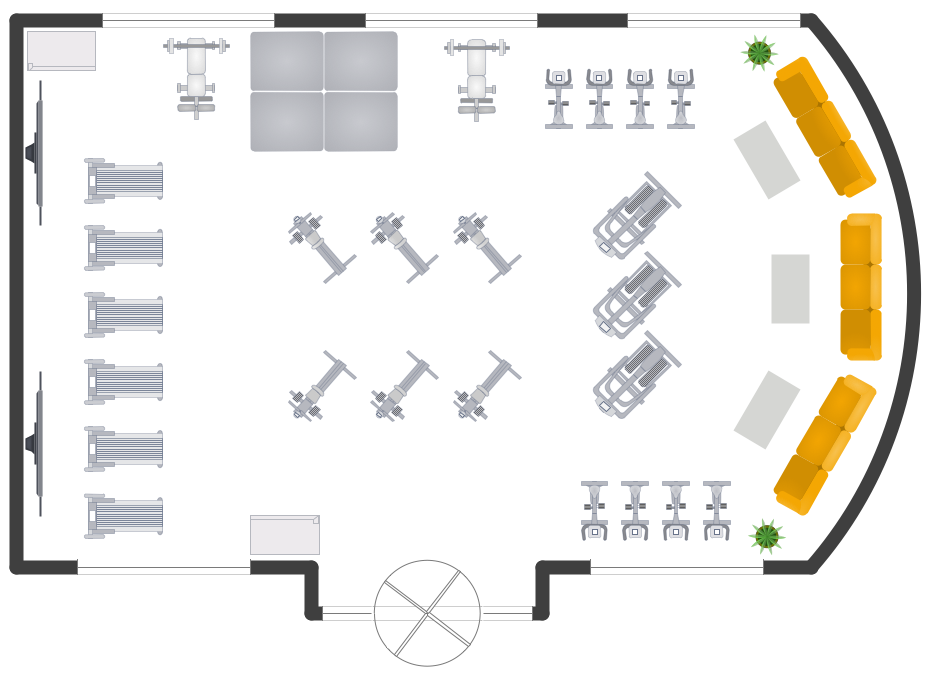
Gym Layout
Local area network (LAN). Computer and Network Examples
 diagram")

Cisco Security. Cisco icons, shapes, stencils and symbols

- Chemistry | Android Filter Icon White Png
- Passbook Icon White Png
- White Searchicon Png
- Security Icon White Png
- Free White Icons Png
- Refresh Icon White Png
- Minimize Button Rectangle Down Arrow Png Icon
- Square Msg Icon Png
- Filter Icon White Png
- White Location Icon Png
- Page Png Icon
- Construction Icon Black And White Png
- White Exit Icon Png
- Mobile @ Website White Icons Png
- Expand Navigation Icon Png Gui
- New White Location Icon Png
- Location Logo White Png
- Share Icon Png
- Logout Icon Png White
- Minimize Maximize Icon Png White