"Network planning and design is an iterative process, encompassing topological design, network-synthesis, and network-realization, and is aimed at ensuring that a new telecommunications network or service meets the needs of the subscriber and operator. Network planning process involves three main steps: 1) Topological design: This stage involves determining where to place the components and how to connect them. 2) Network-synthesis: This stage involves determining the size of the components used, subject to performance criteria such as the Grade of Service (GoS). 3) Network realization: This stage involves determining how to meet capacity requirements, and ensure reliability within the network." [Network planning and design. Wikipedia]
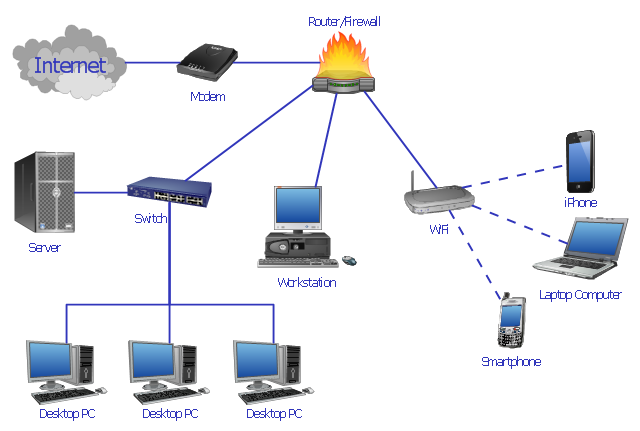
This computer network system design diagram example was created using the ConceptDraw PRO diagramming and vector drawing software extended with the Computer and Networks solution from the Computer and Networks area of ConceptDraw Solution Park.
This computer network system design diagram example was created using the ConceptDraw PRO diagramming and vector drawing software extended with the Computer and Networks solution from the Computer and Networks area of ConceptDraw Solution Park.
Network system design
"Fault-tolerant computer systems are systems designed around the concepts of fault tolerance. In essence, they have to be able to keep working to a level of satisfaction in the presence of faults. ...
Most fault-tolerant computer systems are designed to be able to handle several possible failures, including hardware-related faults such as hard disk failures, input or output device failures, or other temporary or permanent failures; software bugs and errors; interface errors between the hardware and software, including driver failures; operator errors, such as erroneous keystrokes, bad command sequences, or installing unexpected software; and physical damage or other flaws introduced to the system from an outside source." [Fault-tolerant computer system. Wikipedia]
The computer network diagram example "Cisco LAN fault-tolerance system" was created using the ConceptDraw PRO diagramming and vector drawing software extended with the Cisco Network Diagrams solution from the Computer and Networks area of ConceptDraw Solution Park.
LAN fault-tolerance system

Used Solutions
"A document management system (DMS) is a computer system (or set of computer programs) used to track and store electronic documents. It is usually also capable of keeping track of the different versions modified by different users (history tracking). The term has some overlap with the concepts of content management systems. It is often viewed as a component of enterprise content management (ECM) systems and related to digital asset management, document imaging, workflow systems and records management systems. ...
Document management systems commonly provide storage, versioning, metadata, security, as well as indexing and retrieval capabilities." [Document management system. Wikipedia]
The block diagram example "Document management system architecture" was created using the ConceptDraw PRO diagramming and vector drawing software extended with the Block Diagrams solution from the area "What is a Diagram" of ConceptDraw Solution Park.
System architecture diagram

Interactive Voice Response Network Diagram


 Computer and Networks Area
The solutions from Computer and Networks Area of ConceptDraw Solution Park collect samples, templates and vector stencils libraries for drawing computer and network diagrams, schemes and technical drawings.
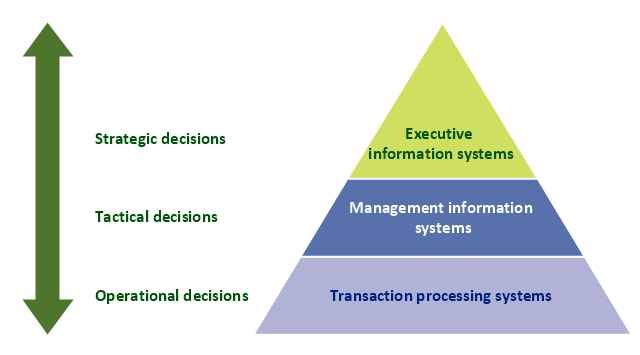
A three level pyramid model of different types of Information Systems based on the type of decisions taken at different levels in the organization. The first level represents transaction processing systems focused on operational decisions.
The second level represents management information systems focused on tactical decisions. The third level represents executive information systems focused on strategic decisions.
"Information system (IS) is the study of complementary networks of hardware and software (see information technology) that people and organizations use to collect, filter, process, create, and distribute data.
The study bridges business and computer science using the theoretical foundations of information and computation to study various business models and related algorithmic processes within a computer science discipline.
Computer information system(s) (CIS) is a field studying computers and algorithmic processes, including their principles, their software and hardware designs, their applications, and their impact on society while IS emphasizes functionality over design.
Any specific information system aims to support operations, management and decision making. In a broad sense, the term is used to refer not only to the information and communication technology (ICT) that an organization uses, but also to the way in which people interact with this technology in support of business processes." [Information systems. Wikipedia]
This diagram was redesigned using the ConceptDraw PRO diagramming and vector drawing software from Wikimedia Commons file Three-Level-Pyramid-model.png. [commons.wikimedia.org/ wiki/ File:Three-Level-Pyramid-model.png]
This file is licensed under the Creative Commons Attribution 3.0 Unported license. [creativecommons.org/ licenses/ by/ 3.0/ deed.en]
The triangle chart example "Information systems types" is included in the Pyramid Diagrams solution from the Marketing area of ConceptDraw Solution Park.
Pyramid diagram
 Interactive Voice Response Diagrams
Interactive Voice Response Diagrams solution extends ConceptDraw PRO v10 software with samples, templates and libraries of ready-to-use vector stencils that help create Interactive Voice Response (IVR) diagrams illustrating in details a work of interactive voice response system, the IVR system’s logical and physical structure, Voice-over-Internet Protocol (VoIP) diagrams, and Action VoIP diagrams with representing voice actions on them, to visualize how the computers interact with callers through voice recognition and dual-tone multi-frequency signaling (DTMF) keypad inputs.
A five level pyramid model of different types of Information Systems based on the information processing requirement of different levels in the organization. The first level represents transaction processing systems to process basic data. The second level represents office support systems to process information in office. The third level represents management information systems to process information by managers. The fourth level represents decision support systems to process explicit knowledge. The fifth level represents executive information systems to process tacit knowledge.
"A Computer(-Based) Information System is essentially an IS using computer technology to carry out some or all of its planned tasks. The basic components of computer based information system are:
(1) Hardware - these are the devices like the monitor, processor, printer and keyboard, all of which work together to accept, process, show data and information.
(2) Software - are the programs that allow the hardware to process the data.
(3) Databases - are the gathering of associated files or tables containing related data.
(4) Networks - are a connecting system that allows diverse computers to distribute resources.
(5) Procedures - are the commands for combining the components above to process information and produce the preferred output.
The first four components (hardware, software, database and network) make up what is known as the information technology platform. Information technology workers could then use these components to create information systems that watch over safety measures, risk and the management of data. These actions are known as information technology services." [Information systems. Wikipedia]
This pyramid diagram was redesigned using the ConceptDraw PRO diagramming and vector drawing software from Wikimedia Commons file Five-Level-Pyramid-model.png. [commons.wikimedia.org/ wiki/ File:Five-Level-Pyramid-model.png]
This file is licensed under the Creative Commons Attribution 3.0 Unported license. [creativecommons.org/ licenses/ by/ 3.0/ deed.en]
The triangle chart example "Information systems types" is included in the Pyramid Diagrams solution from the Marketing area of ConceptDraw Solution Park.
Pyramid diagram

Design Element: IVR for Network Diagrams
")
How To use Switches in Network Diagram

 Cisco Network Diagrams
Cisco Network Diagrams solution extends ConceptDraw PRO software with samples, templates and libraries of vector stencils for drawing the Cisco computer network diagrams.
 Computer Network Diagrams
Computer Network Diagrams solution extends ConceptDraw PRO software with samples, templates and libraries of vector stencils for drawing the computer network topology diagrams.
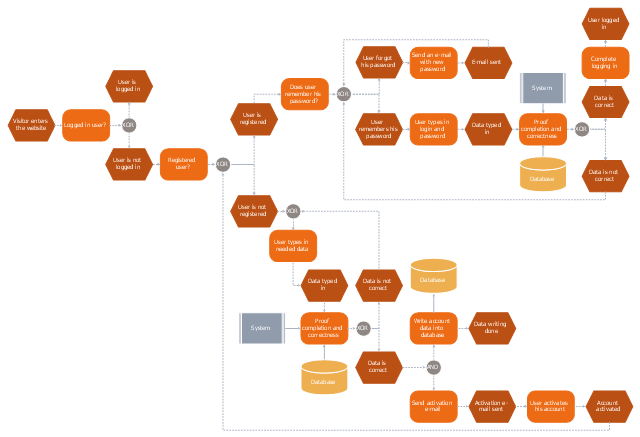
"In computer security, a login or logon refers to the credentials required to obtain access to a computer system or other restricted area. Logging in or on and signing in or on is the process by which individual access to a computer system is controlled by identifying and authenticating the user through the credentials presented by the user.
Once a user has logged in, they can then log out or log off when access is no longer needed. To log out is to close off one's access to a computer system after having previously logged in." [Login. Wikipedia]
The event-driven process chain (EPC) flowchart example "Login and registration processing" was created using the ConceptDraw PRO diagramming and vector drawing software extended with the Event-driven Process Chain Diagrams solution from the Business Processes area of ConceptDraw Solution Park.
EPC flowchart

- How to Draw a Computer Network Diagrams | Computer network ...
- Computer network system design diagram | How to Draw a ...
- How to Draw a Computer Network Diagrams | Computer network ...
- How to Draw a Computer Network Diagrams | Basic CCTV System ...
- Cisco LAN fault-tolerance system - diagram | How to Draw a ...
- Computer network system design diagram | How to Draw a ...
- UML Diagrams with ConceptDraw PRO | How to Draw a Computer ...
- How to Draw a Computer Network Diagrams | UML Diagrams with ...
- Computer network system design diagram | Network Diagramming ...
- How to Draw a Computer Network Diagrams | UML Diagrams with ...
- Computer network system design diagram | Diagramming software ...
- IDEF1X Standard | Computer network system design diagram ...
- How to Draw a Computer Network Diagrams | Cisco Network ...
- How to Draw a Computer Network Diagrams | Design Element: IVR ...
- How to Draw a Computer Network Diagrams | Interactive Voice ...
- How to Draw a Computer Network Diagrams | Network diagrams ...
- How to Draw a Computer Network Diagrams | Engineering ...
- How to Draw a Computer Network Diagrams | Diagramming tool ...
- How to Draw a Computer Network Diagrams | ConceptDraw PRO ...
- How to Draw a Computer Network Diagrams | Computer and ...