Business Productivity Diagramming
Fishbone Diagram - Professional diagramming software for mac helps you create Cause and Effect known as Fishbone diagram or Ishikawa diagram from ConceptDraw Business Productivity solutions on Mac.HelpDesk
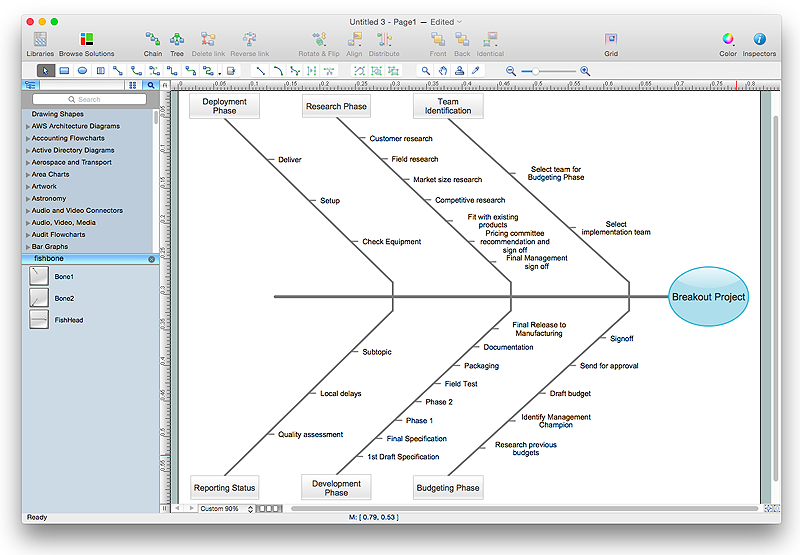
How to Draw a Fishbone Diagram with ConceptDraw PRO
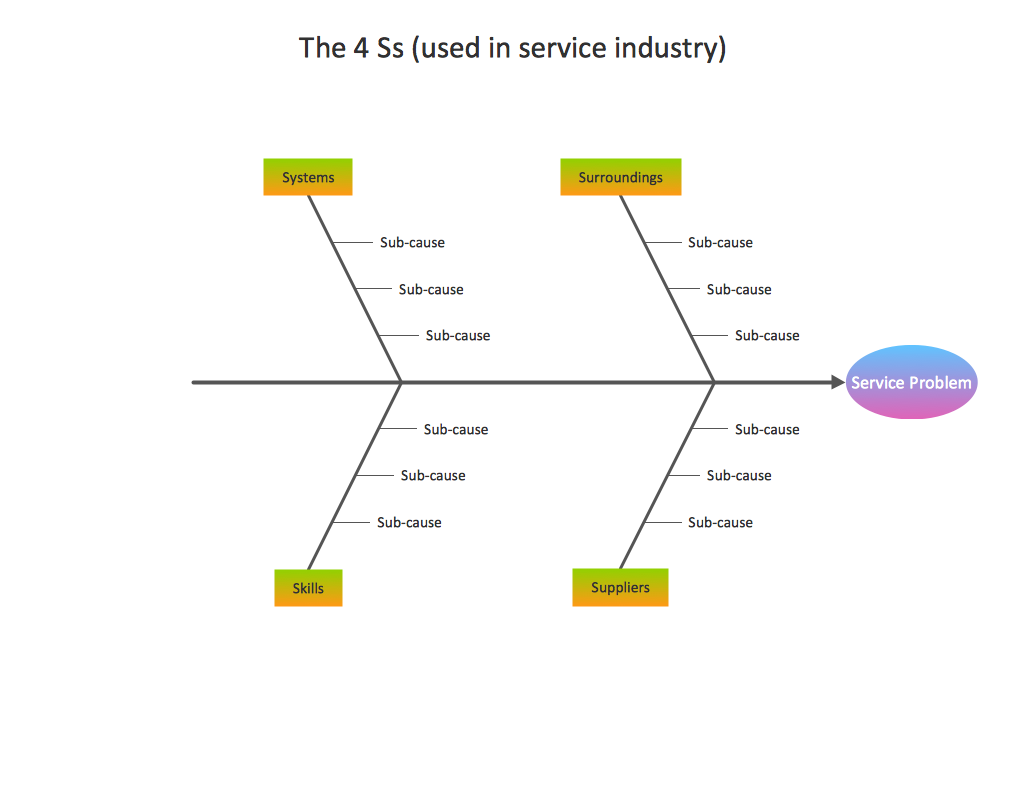
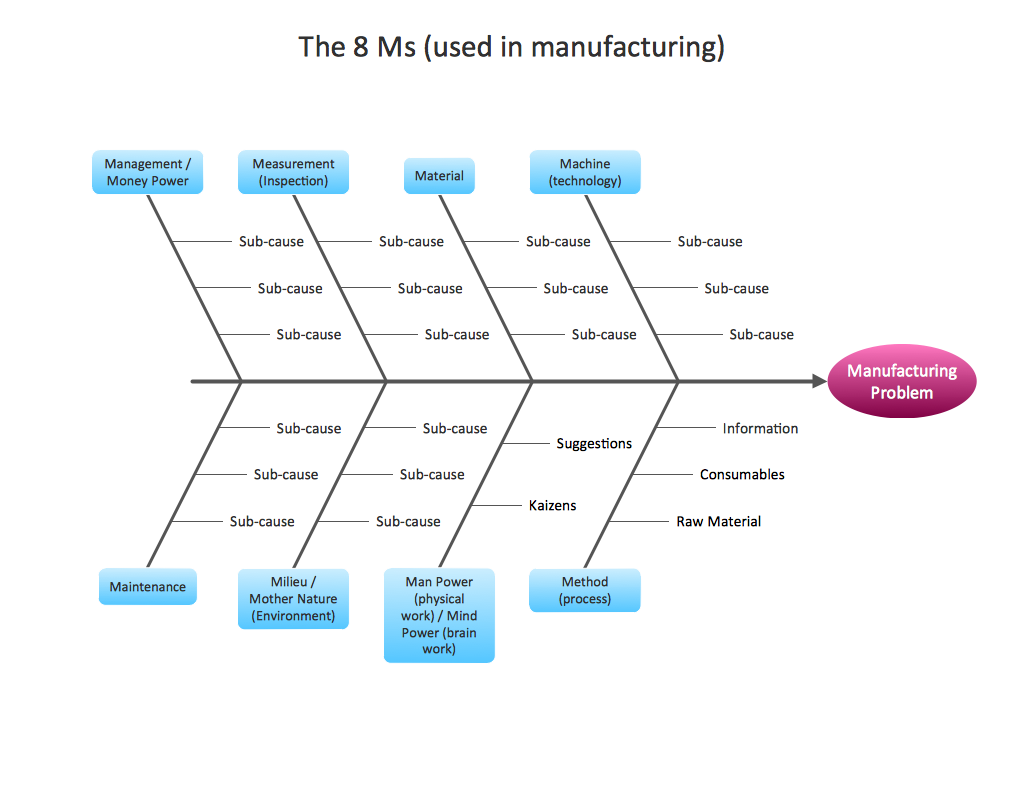
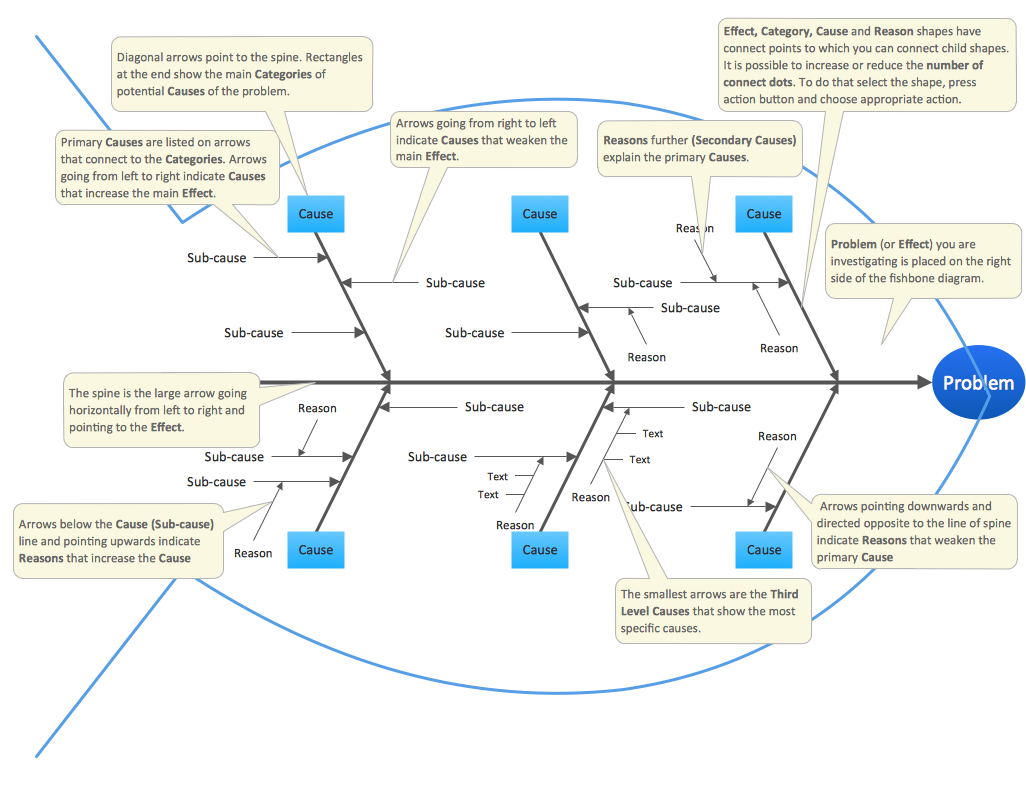
Fishbone (Ishikawa) Diagram is often used in business to determine the cause of some problem. The main goal of the Fishbone diagram is to illustrate in a graphical way the relationship between a given outcome and all the factors that influence this outcome.The ability to create a Fishbone Diagram is supported by the Fishbone Diagram solution.
 Fishbone Diagram
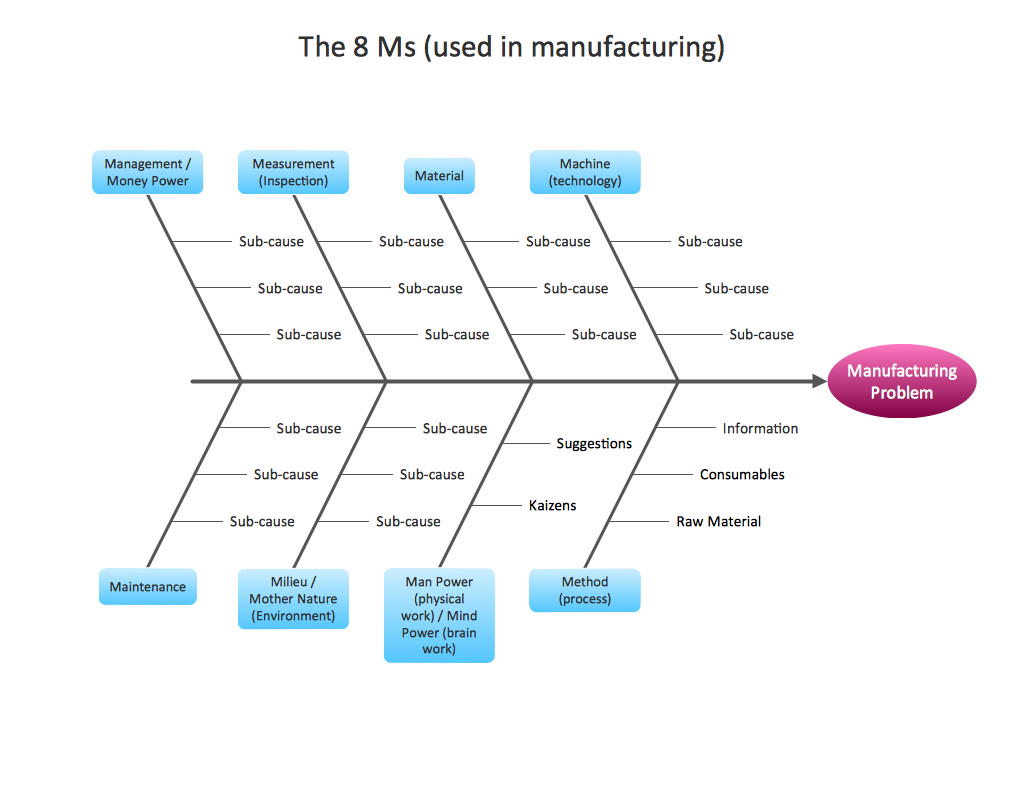
Fishbone Diagrams solution extends ConceptDraw PRO software with templates, samples and library of vector stencils for drawing the Ishikawa diagrams for cause and effect analysis.
Business Productivity Diagramming
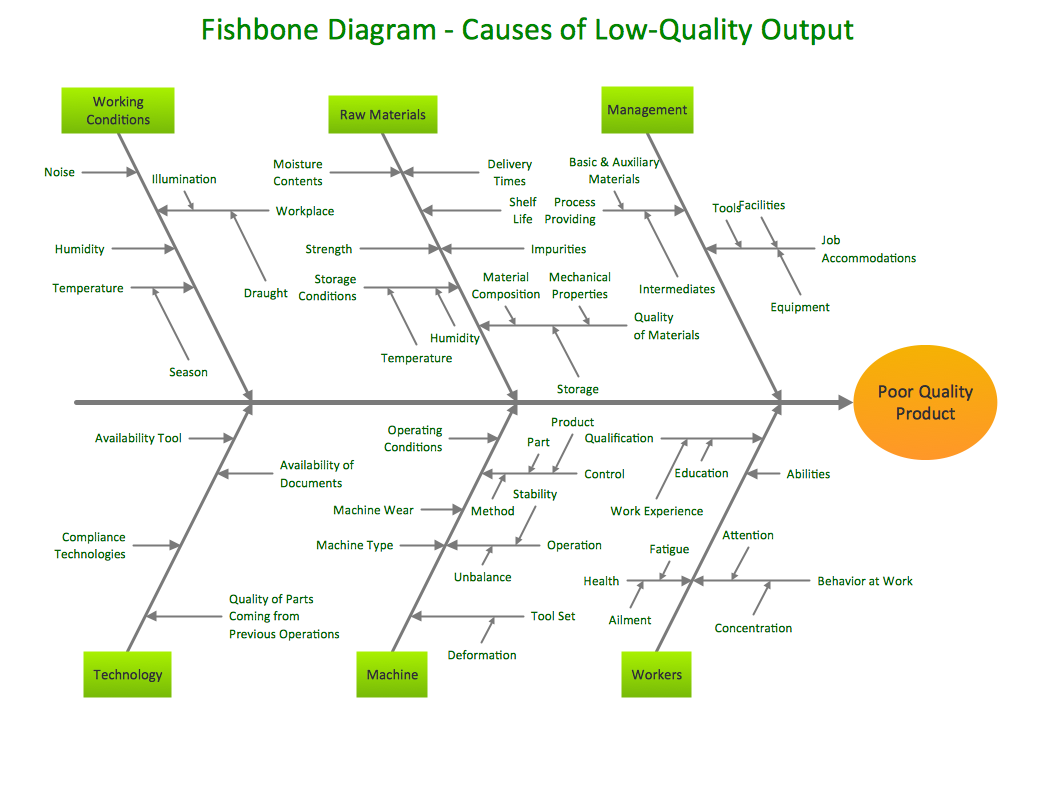
Analyze process dispersion with conceptdraw pro diagramminf tool. The resulting fishbone diagram (ishikawa diagram) illustrates the main causes and subcauses leading to an effect (symptom).
 Fishbone Diagrams
Fishbone Diagrams solution extends ConceptDraw PRO software with templates, samples and library of vector stencils for drawing the Ishikawa diagrams for cause and effect analysis.
HelpDesk
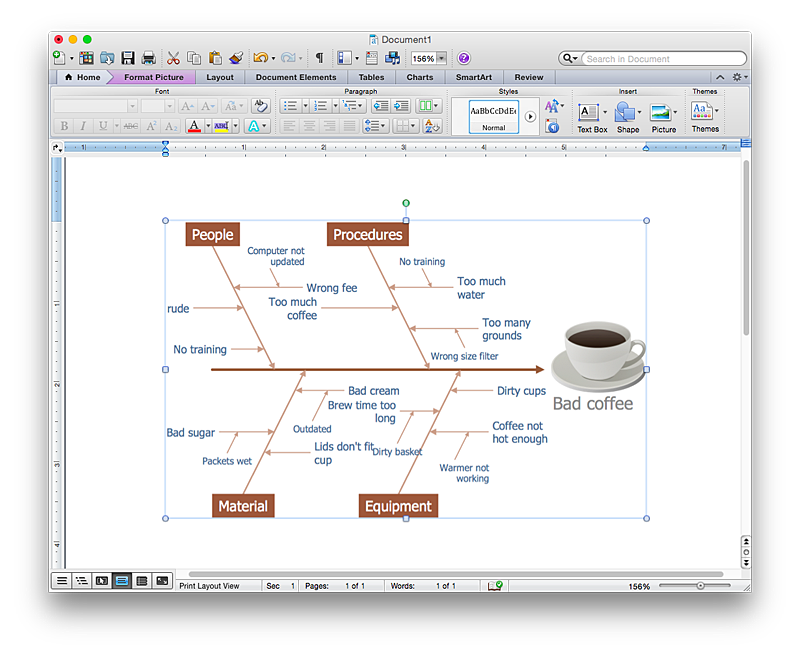
How to Add a Fishbone (Ishikawa) Diagram to a MS Word Document Using ConceptDraw PRO
The ability to create a fishbone (Ishikawa) Diagram is supported by the ConceptDraw Fishbone Diagram solution. ConceptDraw PRO allows you to easily create a fishbone diagrams and then insert them into a MS Word document.HelpDesk
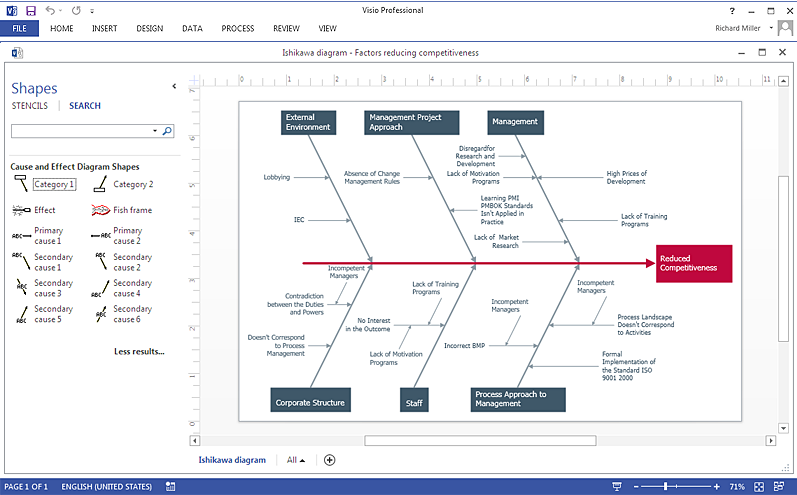
How To Create a MS Visio Cause and Effect Diagram Using ConceptDraw PRO
ConceptDraw PRO allows you to easily create Fishbone (Ishikawa) diagrams and then make a MS Visio file from your diagrams in a single click.HelpDesk
How to Create a Fishbone (Ishikawa) Diagram Quickly
Use ConceptDraw MINDMAP for structuring data and then ConceptDraw PRO for generatinga Fishbone Diagram from mind map structure.
Business Productivity Diagramming
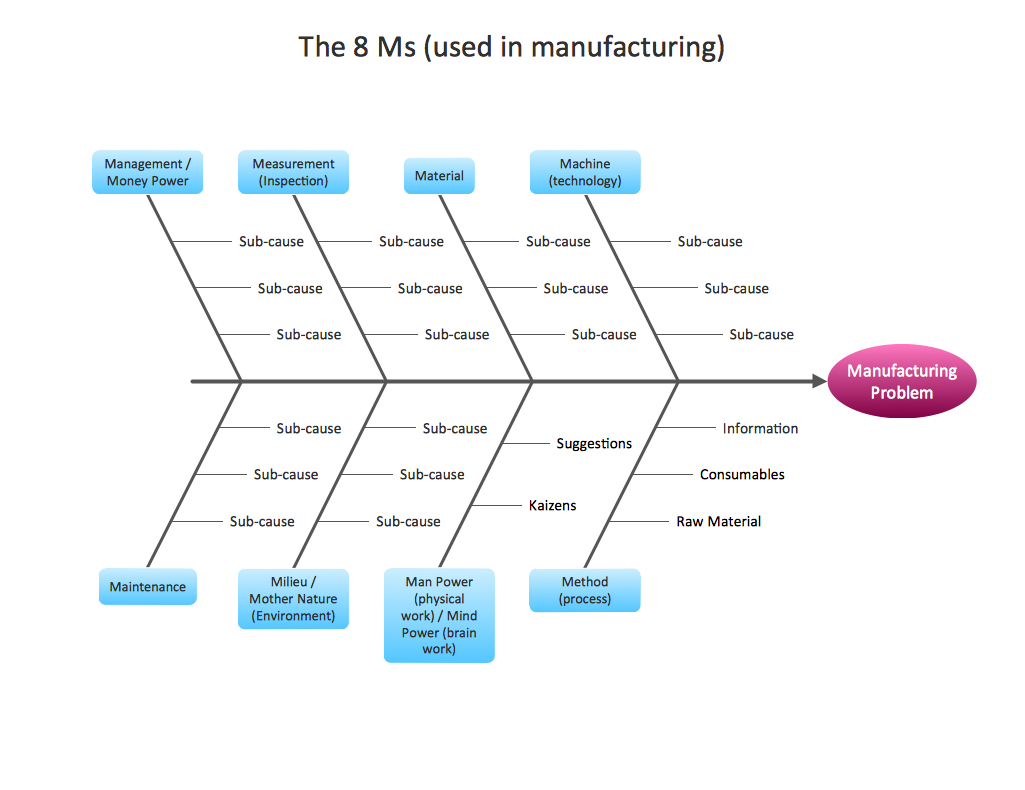
Fishbone diagrams work for most entrepreneurs and almost any industry or person having a problem. Professional diagramming software may help you create Fishbone (Cause and Effect or Ishikawa) diagrams. When people are unclear about what is causing an issue, ConceptDraw PRO will be your lifesaver. When you need to use a Fishbone diagram, use one of ConceptDraw templates.Business Productivity Diagramming
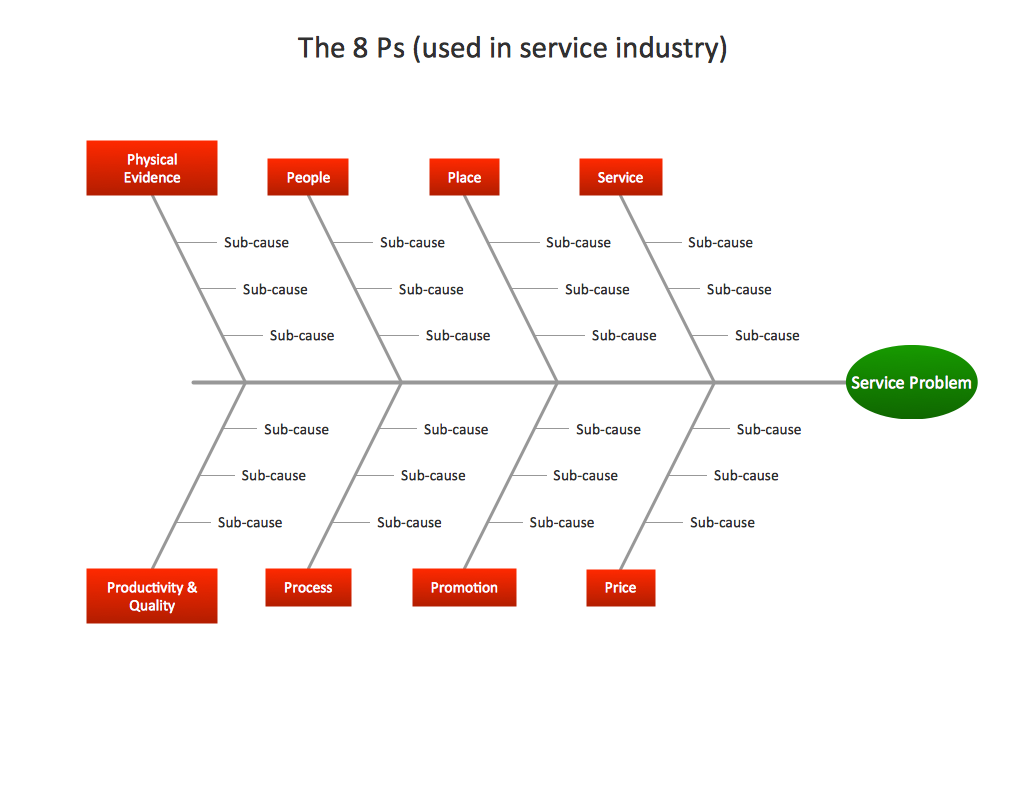
Create fishbone diagram from templates and examples with professional diagramming software, Conceptdraw helps you create cause and effect, fishbone, ishikawa diagrams.Business Productivity Diagramming
Professional diagramming software helps you create cause and effect, fishbone, ishikawa diagrams from templates and examples.Cause and Effect Analysis (Fishbone Diagrams)
Try now this professional diagramming software for problem solving diagram, Cause and Effect diagram, Fishbone diagram, Ishikawa diagram to create easy analysis charts and visualize problem of your business.Business Productivity Diagramming
Create professional Fishbone diagrams using software templates. To help you with Analisys and Troubleshooting, we created Cause-and-Effect, Fishbone, Ishikawa diagrams examples and many more.Business Productivity Diagramming
When you need to focus on the problem, professional diagramming tool help you create a Fishbone diagram (Ishikawa diagram). Understanding of the problem via Fishbon diagram will improve the processes between Departments and Teams.Business Productivity Diagramming
ConceptDraw PRO is a professional software which helps you draw business productivity diagram, cause and effect, fishbone, ishikawa diagrams to solve problems on your business.Business Productivity Diagramming
Professional diagramming software helps you create cause and effect example, fishbone diagram example, ishikawa diagram example from ConceptDraw templates and examples.Use a Fishbone Diagram to Attack Complex Problems
Use diagramming software to attack any complex problems. Fishbone diagram can help you find an effective solution to analyze the complex Business problems and solve it. Draw Fishbone Diagram to help users brainstorm and break down a complex problem.Business Productivity Diagramming
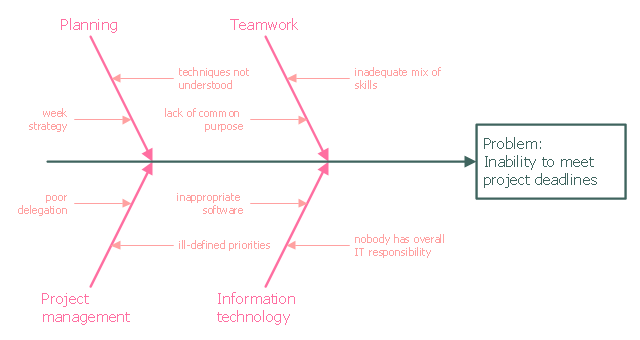
This diagramming software will help you create Problem Solving diagram also called as Cause-and-Effect or Fishbone diagram. It is a problem analizing and solving method, which can be drawn even by a beginner.This example was created on the base of the figure from the website of the Iowa State University Center for Excellence in Learning and Teaching.
"Fishbone.
What: The fishbone technique uses a visual organizer to identify the possible causes of a problem.
Benefits: This technique discourages partial or premature solutions and demonstrates the relative importance of, and interactions between, different parts of a problem.
How: On a broad sheet of paper, draw a long arrow horizontally across the middle of the page pointing to the right. Label the arrowhead with the title of the issue to be explained. This is the "backbone" of the "fish." Draw "spurs" from this "backbone" at about 45 degrees, one for every likely cause of the problem that the group can think of; and label each. Sub-spurs can represent subsidiary causes. The group considers each spur/ sub-spur, taking the simplest first, partly for clarity but also because a simple explanation may make more complex ones unnecessary. Ideally, the fishbone is redrawn so that position along the backbone reflects the relative importance of the different parts of the problem, with the most important at the head." [celt.iastate.edu/ creativity/ techniques.html]
The fishbone diagram example "Inability to meet project deadlines" was created using the ConceptDraw PRO diagramming and vector drawing software extended with the Fishbone Diagrams solution from the Management area of ConceptDraw Solution Park.
Ishikawa Diagram
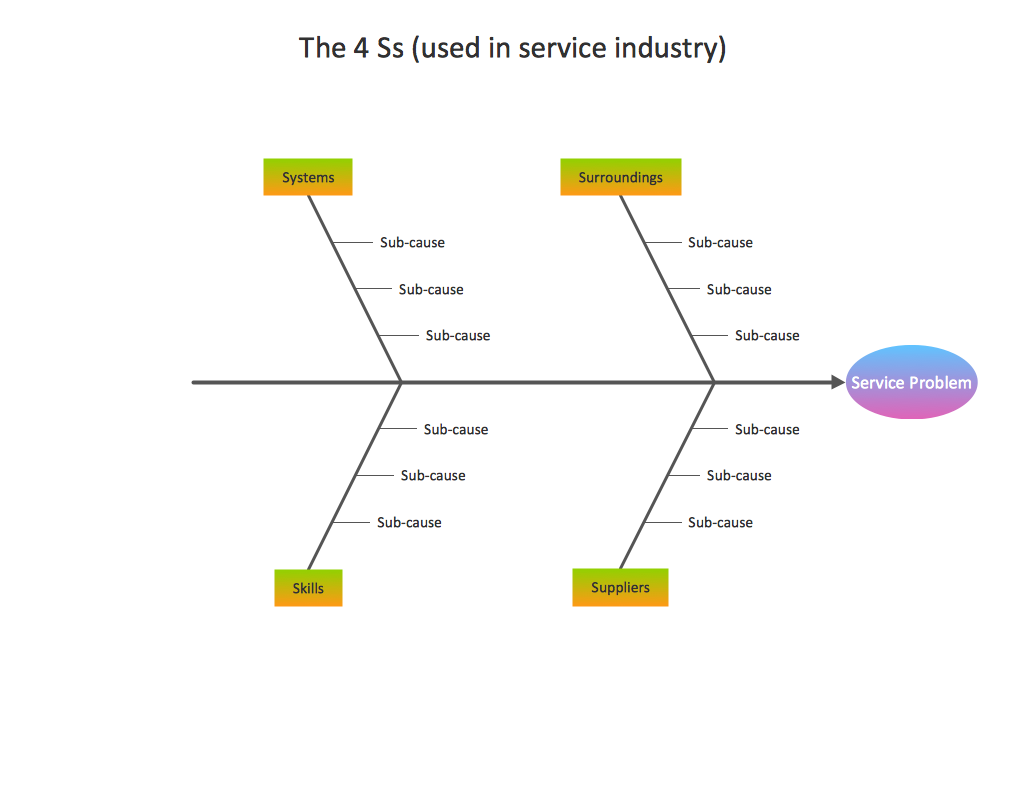
ConceptDraw PRO diagramming and vector drawing software extended with Fishbone Diagrams solution from the Management area can help you with construction the Fishbone Diagram also known as Ishikawa Diagram.Ishikawa Diagram shows factors of Equipment, Process, People, Materials, Environment and Management, all affecting the overall problem in one drawing for the further analysis. It is a well effective way to analyze the business problems you must identify and solve
- Workflow Process Example | Fishbone Diagram | Process Flowchart ...
- Fishbone Diagram | How to Draw a Computer Network Diagrams ...
- Business Productivity Diagramming | Fishbone Diagram | Design ...
- How to Draw a Computer Network Diagrams | Fishbone Diagram ...
- Fishbone Diagram | Business Process Diagram | How to Draw a ...
- Cause and Effect Analysis ( Fishbone Diagrams) | Business ...
- How to Draw an Organization Chart | Fishbone Diagram ...
- Computer Network Architecture | How to Draw a Computer Network ...
- Best Vector Drawing Application for Mac OS X | Fishbone Diagram ...
- Fishbone Diagram | Total Quality Management with ConceptDraw ...
- Fishbone Diagram | Business Productivity Diagramming | Business ...
- Fishbone Diagram | Business Productivity Diagramming | Using ...
- Fishbone Diagram | Universal Diagramming Area | Simple & Fast ...
- Fishbone Diagram | Business Productivity Diagramming | Business ...
- UML Diagrams with ConceptDraw PRO | Basic Diagramming ...
- Fishbone Diagrams
- Network Architecture | Computer and Networks | Fishbone Diagram ...
- Fishbone Diagram | Value Stream Mapping | Business Productivity ...
- Business Productivity Diagramming | Fishbone Diagram ...
- Fishbone Diagram | Business Diagram Software | Diagramming tool ...
