 Fishbone Diagram
Fishbone Diagrams solution extends ConceptDraw PRO software with templates, samples and library of vector stencils for drawing the Ishikawa diagrams for cause and effect analysis.
 Business Process Diagrams
Business Process Diagrams solution extends the ConceptDraw PRO BPM software with RapidDraw interface, templates, samples and numerous libraries based on the BPMN 1.2 and BPMN 2.0 standards, which give you the possibility to visualize equally easy simple and complex processes, to design business models, to quickly develop and document in details any business processes on the stages of project’s planning and implementation.
 Entity-Relationship Diagram (ERD)
Entity-Relationship Diagram (ERD) solution extends ConceptDraw PRO software with templates, samples and libraries of vector stencils from drawing the ER-diagrams by Chen's and crow’s foot notations.
Design Element: Rack Diagram for Network Diagrams
ConceptDraw PRO is perfect for software designers and software developers who need to draw Rack Diagrams.
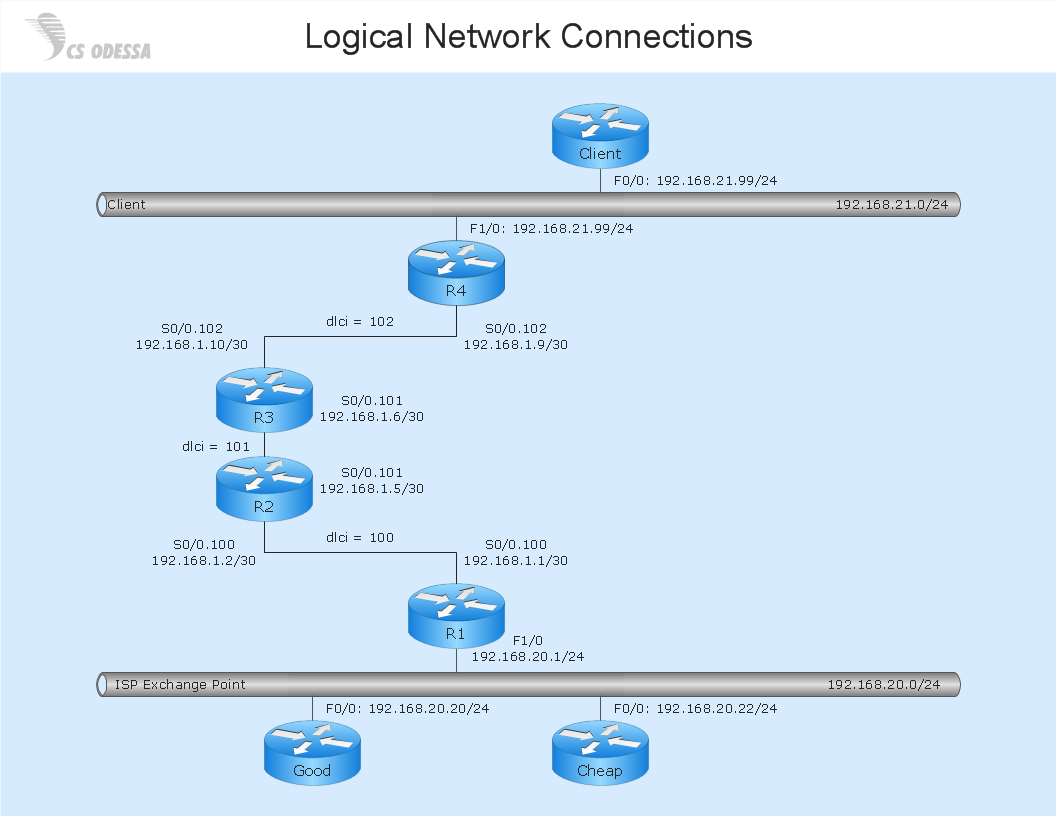
Network Diagram Software Logical Network Diagram
Perfect Network Diagramming Software with examples of LAN Diagrams. ConceptDraw Network Diagram is ideal for network engineers and network designers who need to draw Logical Network diagrams.
How to Draw Business Process Diagrams with RapidDraw Interface
Business Process Modeling Notation (BPMN) is a set of standard symbols that allow you to create a graphical view of a business process. The symbols were developed to help users develop standard, unified structure of processes, and any messages shared between these processes.
 Event-driven Process Chain Diagrams
Event-driven Process Chain (EPC) Diagram is a type of flowchart widely used for modeling in business engineering and reengineering, business process improvement, and analysis. EPC method was developed within the Architecture of Integrated Information Systems (ARIS) framework.
 ConceptDraw Solution Park
ConceptDraw Solution Park collects graphic extensions, examples and learning materials
- Fishbone Diagram | How to Draw a Computer Network Diagrams ...
- ER Diagrams with ConceptDraw PRO | ConceptDraw PRO ER
- How to Draw a Computer Network Diagrams | How To Draw a ...
- Fishbone Diagram | How to Draw a Computer Network Diagrams ...
- Basic Diagramming | Block Diagrams | Create Block Diagram |
- Basic Diagramming | The Best Drawing Program for Mac | Block ...
- Entity Relationship Diagram Software for Mac | How to Draw ER ...
- Entity-Relationship Diagram (ERD) | ConceptDraw PRO Database ...
- How to Draw a Computer Network Diagrams | 3D Network Diagram ...
- Conceptdraw .com: Mind Map Software, Drawing Tools | Project ...
- ConceptDraw PRO ER Diagram Tool | ER Diagram Programs for ...
- Pyramid Chart Examples | How to Draw an Organization Chart ...
- ConceptDraw PRO Network Diagram Tool | How to Draw a ...
- Network Diagram Examples
- How To create Diagrams for Amazon Web Services architecture ...
- How to Draw a Computer Network Diagrams | Network diagrams ...
- Entity-Relationship Diagram (ERD) | ER Diagrams with ...
- Computer network system design diagram | How to Draw a ...
- How to Draw a Computer Network Diagrams | Network Diagram ...
- Simple & Fast Diagram Software | Create Flow Chart on Mac | Easy ...
.png)

