Viruses
Viruses are microscopic infectious organisms, the smallest of all microbes, but the most abundant biological entity on Earth. They exist almost everywhere on our planet and their main goal is to multiple. They strive to make more and more their own copies. Viruses possess the unique capability to attach to the cells of other living organisms, get inside them and multiply there. The cells they enter are called host cells.
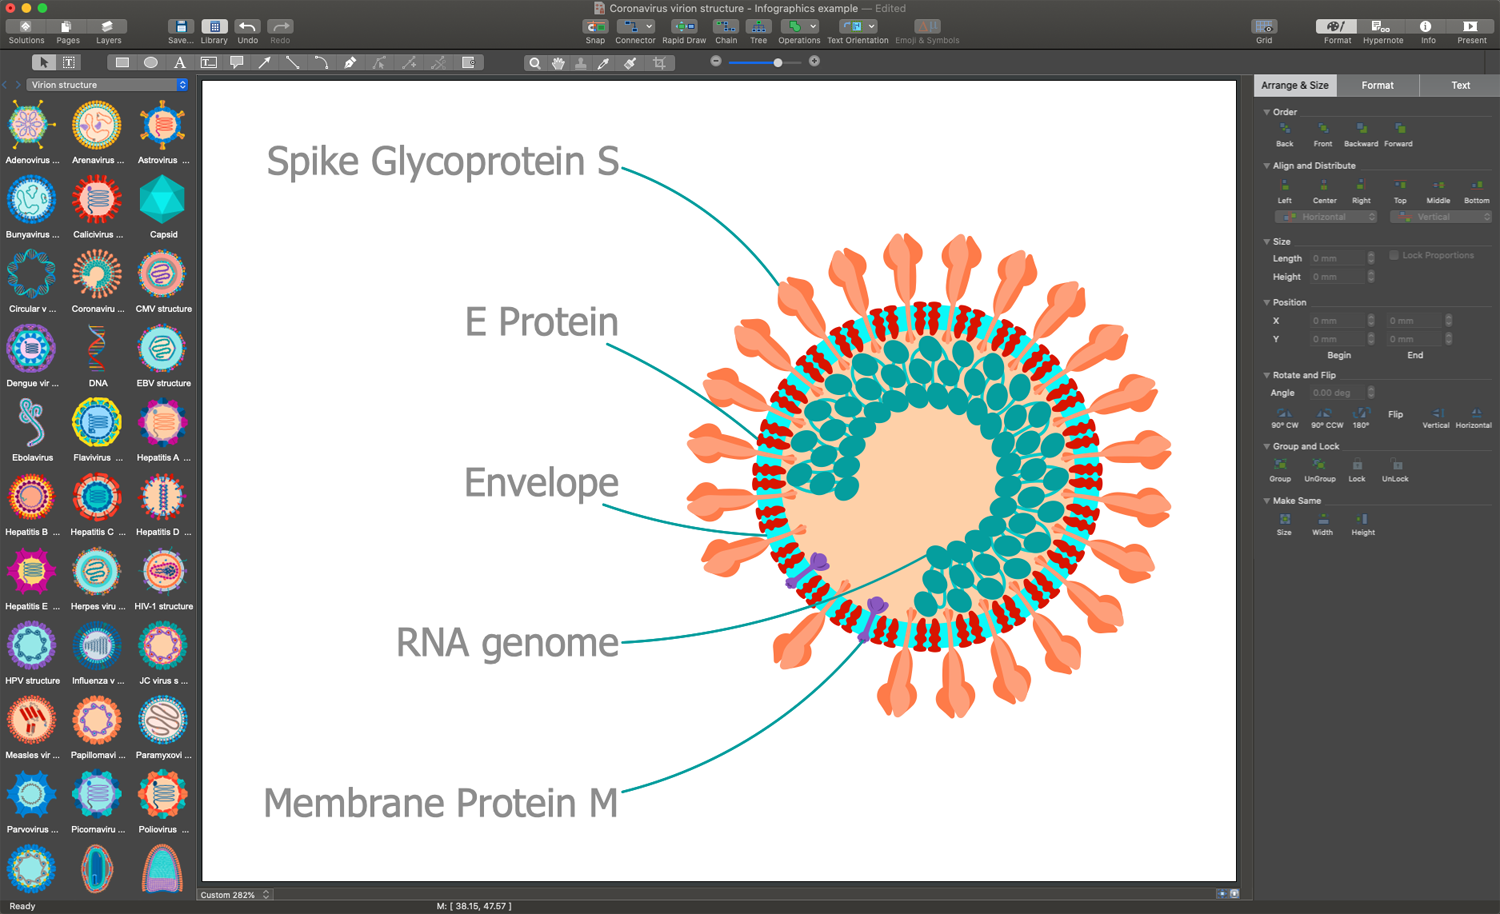
Viruses have a simple structure. The infectious virus particle is called a virion. It includes a core of genetic material (DNA or RNA) and a protective coat surrounded it. This coat is called a nucleocapsid and is made up of a protein (capsid). Sometimes, a nucleocapsid is surrounded by a lipid envelope consisting of the glycoprotein spikes haemagglutinin (H) and neuraminidase (N). This additional coat is called an envelope. The sizes and shapes of viruses also differ, there are helical, icosahedral shapes, and their combinations.
Viruses cannot multiply by themselves, only in living cells of people, animals, plants, fungi, and even bacteria. That's why they are classified as parasitic. At this, viruses use the host cell’s machinery to replicate their genetic material. Once replication (multiplication) has been completed the new virus particles leave the host cells. They are bursting out into the extracellular space or budded of the host cells.
When the viruses are burst out, the host cell deaths. At the same time, just escaped the new virus is already ready to enter a new cell and multiply there. As for the budding mechanism, viral particles push the host cell’s plasma membrane, their parts are adhered to it and the plasma membrane envelops these viruses. Now, they are released from the cells, but the host’s cell membrane is thinning and cells gradually death.
Many diseases are caused by viruses: SARS, flu, COVID-19, hepatitis, measles, chickenpox, mumps, rubella, smallpox, shingles, herpes, cold sores, polio, rabies, dengue fever, Zika, Epstein-Barr, Ebola, Hanta fever, HPV, HIV, and many more.
As for the origin of viruses, there are three theories:
- Viruses evolved from complex molecules of nucleic acid and proteins billions of years ago when the first cells appeared on Earth.
- Viruses evolved from sections of DNA or RNA from the genes of larger organisms.
- Viruses appeared as independent parasitic organisms. Over time, they lost genes allowing them to parasitize and became dependent on the host cells.
Viruses can spread from mother to child prenatally, from person to person, sometimes from animal to person. They are spread through touch and direct contact, kiss, coughing, sneezing, or sexual contact. Viruses are transmitted by insects, with contaminated food or water. They can live on things for some time and things may contribute spreading of viruses. If a sick person touched a thing, the next person can pick up a virus by touching the same one.
Example 1. Viruses in Infographics and Illustrations
There are some viruses causing no noticeable reactions being entered a living organism. However, there are ones causing serious consequences and even fatal. Besides, viruses are highly selective. Typically, they affect only one type of organism or affect differently varied organisms. A virus affecting animals commonly doesn't affect a human and vice versa, but there are exceptions. A virus affecting a cat may not affect a dog and vice versa, etc.
One more unique and dangerous capability of viruses is their ability to change or mutate. When a virus spreads, it can pick up some pieces of DNA of its host. Being entered into another organism, the virus takes these pieces to it. When entering the host’s DNA, viruses can affect a genome, move around a chromosome or to a new chromosome. This can cause serious and long-term effects in a person's organism like muscular dystrophy or hemophilia. More serious mutations also happen. A dangerous virus can appear if a virus normally affecting animals or birds suddenly enters a human body and picks up a piece of human DNA.

Example 2. Medical Virology Infographic - Virus Size
The graphical representation is the best way to depict important information and data in any field, and health and medicine aren't exceptions. Having the ConceptDraw DIAGRAM charting and drawing software and Medical Virology solution you can design the great-looking Medical Virology infographics and drawings in a few minutes. Create illustrations about viruses and ways to fight them effectively, virion structures, virus protection and prevention ways, immunity and ways to strengthen it.

Example 3. Virus Transmission Library Design Elements
A large collection of samples and examples included in the Medical Virology solution is incredibly varied. It includes the illustrations of COVID-19 symptoms, coronavirus virion structure, viruses sizes, social distancing, and many more. They are also useful as a quick start when drawing your own infographics.

Example 4. Rabies Virus Sructure
The infographics you see on this page show the information about viruses and were created in ConceptDraw DIAGRAM software using the virology-related pictograms from the Medical Virology Solution libraries. They successfully demonstrate the solution's capabilities and professional results you can achieve. An experienced user spent 10-15 minutes creating each of these samples.
Use the powerful tools of the Medical Virology Solution for ConceptDraw DIAGRAM software to create your own infographics and diagrams of any complexity fast and easy, and then successfully use them in your work activity.
All source documents are vector graphic documents. They are available for reviewing, modifying, or converting to a variety of formats (PDF file, MS PowerPoint, MS Visio, and many more graphic formats) from the ConceptDraw STORE. The Medical Virology Solution is available for all ConceptDraw DIAGRAM users.
TEN RELATED HOW TO's:
Agile methodology is an excellent alternative to waterfall and traditional sequential development. ConceptDraw DIAGRAM software extended with SCRUM Workflow solution is ideal for quick and easy designing various diagrams, charts, mind maps and schematics illustrating software development using Agile methodologies, and in particular Scrum methodology.
Picture: Agile Methodology
Related Solution:
Any information system receives data flows from external sources. In order to visualize them there is a list of data flow diagram symbols that describes how the system components cooperate. If you want to create a data flow diagram, ConceptDraw DIAGRAM Solution Park has DFD Library that contains both Yourdon and Gane-Sarson notations.
This figure shows the content of vector libraries, delivered with ConceptDraw solution for data flow diagram (DFD). There are three libraries composed from about 50 vector objects used to make data flow diagrams.
They include a complete set of objects utilized by Yourdon-Coad and Gane-Sarson notations - two primary notations that are apply for data flow diagramming. Also, one can discover additional "Data flow diagram (DFD)" library that provides a data flow diagram elements for designing level 1 and context-level data flow diagrams.
Picture: Data Flow Diagram Symbols. DFD Library
Related Solution:
There are many ways to define the flow of information within a system. Structured-systems analysis method often uses data flow diagrams to show data flow, data storages and data processing visualization. These diagrams are easy to develop and quite useful.
Here is a dataflow diagram presenting an example of the manufacturing process flow. The oval process shapes represent a process that controls data within the current system. The process may produce data or make some action based on data. Data flows are represented by lines. They show the movement of information through the system. The direction of the data flow is depicted by the arrow. The external entities are shown by rectangles. They represent the external entities interacting with the system. The data store objects (unclosed rectangles) are used to show data bases participating in a process flow.
Picture: Data Flow Diagram
Related Solution:
There are numerous articles about the advantages of flowcharting, creating business graphics and developing different charts. Nevertheless, these articles are almost useless without the main component - the examples of flowcharts, org charts and without a fine example, it is difficult to get all the conveniences of creating diagrams. You can find tons of templates and vivid examples on Solution Park.
This illustration shows a variety of business diagrams that can be created using ConceptDraw DIAGRAM. It comprises a different fields of business activities: management, marketing, networking, software and database development along with design of infographics and business illustrations. ConceptDraw DIAGRAM provides a huge set of sample drawings including business process modeling diagrams,, network diagrams, UML diagrams, orgcharts, DFD, flowcharts, ERD, geographical maps and more.
Picture: Examples of Flowcharts, Org Charts and More
Related Solution:
When we think about programming, we usually imagine sleepless nights spent on writing kilobytes of code. However, from another point of view, Software development with ConceptDraw DIAGRAM makes a programmer's life endlessly easier. This tool is unique to fulfill all your needs in short period of time.
Over the recent years object-oriented methodology has become more and more widespread. Thanks to this methodology developers manage to deal with growing complexity of applications. More and more programs are written in such programming languages as C++, Java, Visual Basic and Object Pascal. However, the complexity of the designed systems imposes extended requirements as to design of graphic documentation. ConceptDraw possesses powerful tools for designing of technical documentation for object-oriented projects. The libraries included in the package allow to easily draw class hierarchies, object hierarchies and diagrams of data flows with the use of the most popular notations, including UML and Booch notations. And the library for projecting COM-interfaces will spare developers of ActiveX-servers a headache.
Picture: Software development with ConceptDraw DIAGRAM
IT world is extremely rational and logical. So what can be more precise than Software Diagrams to rate the results of work? Visual statistics is the best way to understand the data.
This figure demonstrates the data flow diagram (DFD), which was created to describe the electronic system of custom purchase. This is the process of buying using electronic bar code scanning system. Such systems are used in large stores. The cashier scans the bar code, the system outputs the data on the price of the goods and carries out a purchase process. This DFD utilizes the Gane/Sarson notation. To create it The ConceptDraw DFD solution has been applied.
Picture: Software Diagrams
Meeting ice hockey rules one should learn ice hockey rink terms, lines, zones etc. ConceptDraw DIAGRAM is an advanced drawing software that allows you produce ice hockey rink depiction of any complexity, from simple sketch drawing to detailed one as on example below.
Picture: Ice Hockey Rink Dimensions
Related Solution:
When we start to speak about databases, we must always mention database structure visualization. One of the most common ways to do it is to create an entity relationship diagram, and to put appropriate symbols on it. It is important either for database projecting and for its' future maintenance.
Entity Relationship Diagram describes data elements and their relationships within a database. There are a set of special symbols that depict each element of an entity relationship diagram. Entities - represents some stable components such as supplier, employee, invoice, client, etc. Relation symbols show how the entities interact. Attributes define characteristics of the relationships. Attributes can be one-to-one or many-to-many. Physical symbols is used in the physical models. They represent items such as fields, tables, types and keys. ERD physical symbols are the building material for the database. Notation lines are used to illustrate the relationships. The most common method is Crow’s Feet notation. You can use ConceptDraw Entity-Relationship Diagram (ERD) solution to represent a database using the Entity-Relationship model.
Picture: Entity Relationship Diagram Symbols
Related Solution:
The SWOT Analysis solution contains easy-to-use mind map templates that help identify Strengths, Weaknesses, Opportunities, and Threats, as well as outputs to ConceptDraw DIAGRAM for presenting analysis results.
Picture: SWOT Analysis
Related Solution:
The recruitment process often requires design and use of various HR flowcharts, diagrams, attractive illustrations.
Picture: Recruitment
Related Solution:


