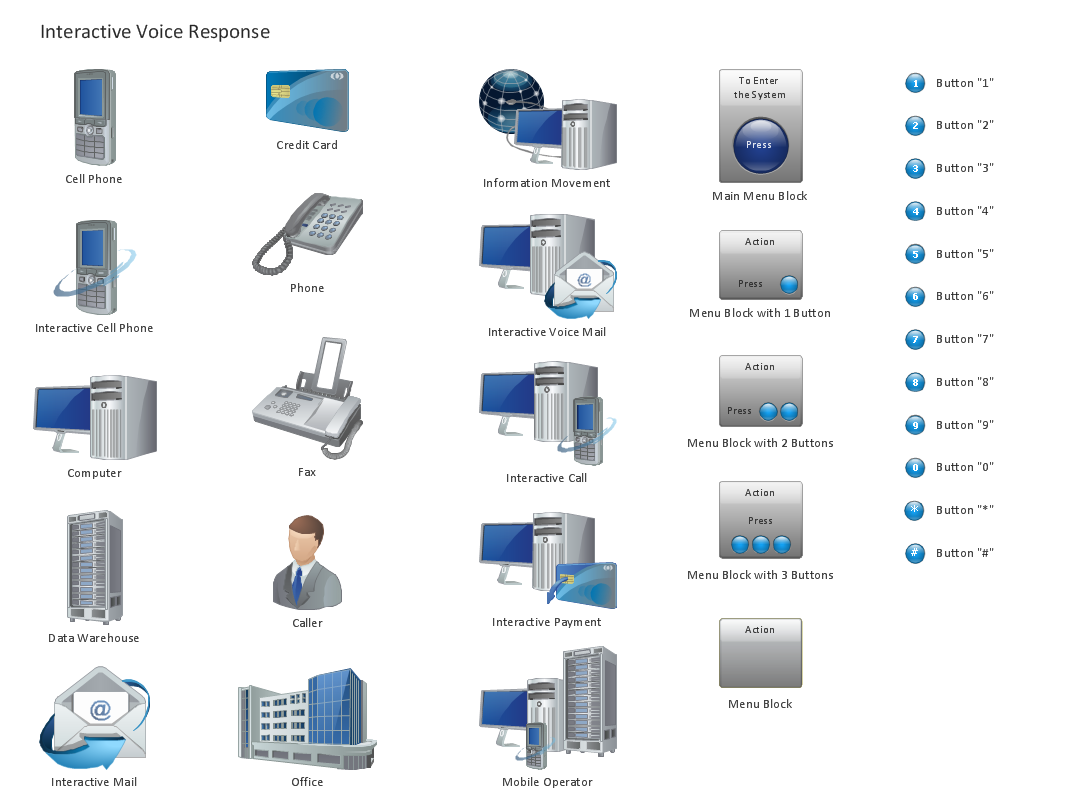
ConceptDraw solution Computer and Networks provides Interactive Voice Response library of 35 vector stencils for drawing the IVR network diagrams.
Use these libraries of design elements to visualize the logical and physical structure of IVR systems for inbound and outbound call centers and voice mail systems.
TEN RELATED HOW TO's:
One of the three main constituents of any enterprise is the Control and Information Architecture. The rest two are Production facilities and People and Organization.
Picture: Control and Information Architecture Diagrams (CIAD) with ConceptDraw DIAGRAM
Interactive Voice Response (IVR) Network Diagram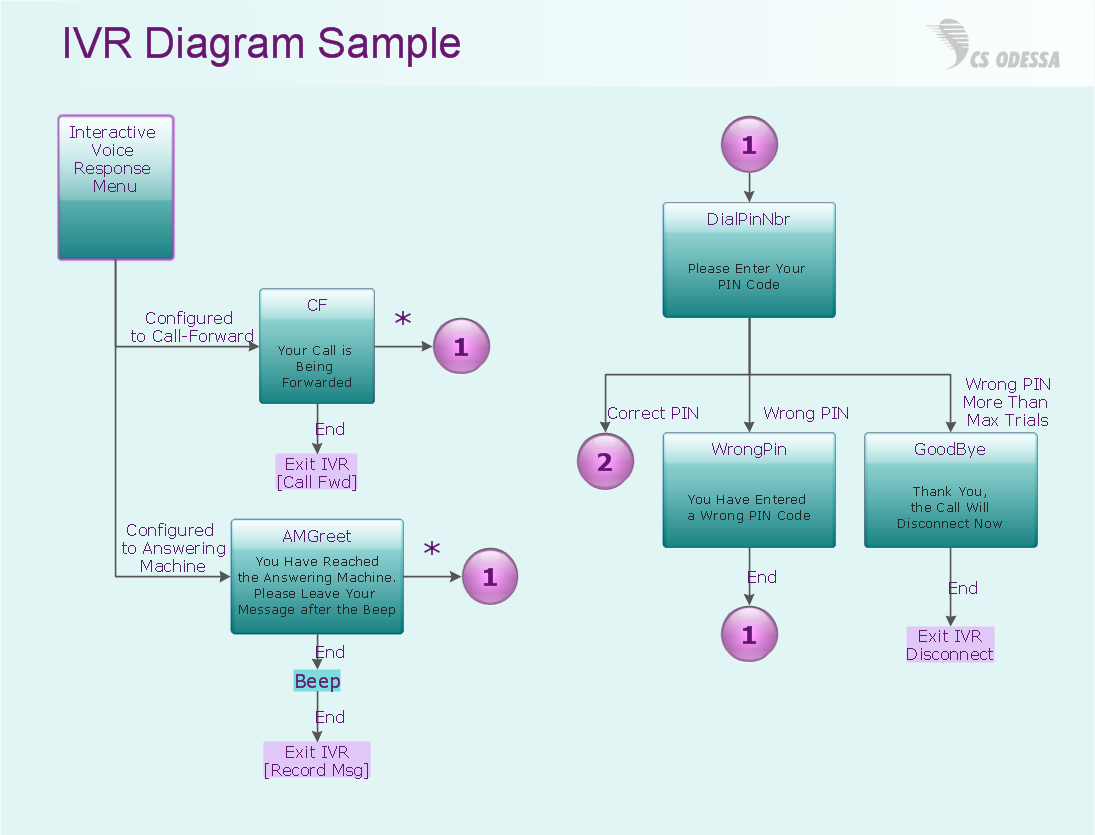
Picture: IVR Network Diagram
Closed-circuit television (CCTV) uses cameras and monitors to carry out video surveillance. Unlike broadcast television this system has only local signal. It is a feature of almost every video camera, yet CCTV is mainly a system for visual control of certain areas such as banks, airports, supermarkets, and other places for security reasons.
Developing and installing CCTV system is a time-consuming process. It also requires certain knowledge and skills. ConceptDraw is a solution of setting video cameras rationally. You can achieve two aims at once: CCTV Design Tool saves your time and your money and helps you make professional video surveillance system.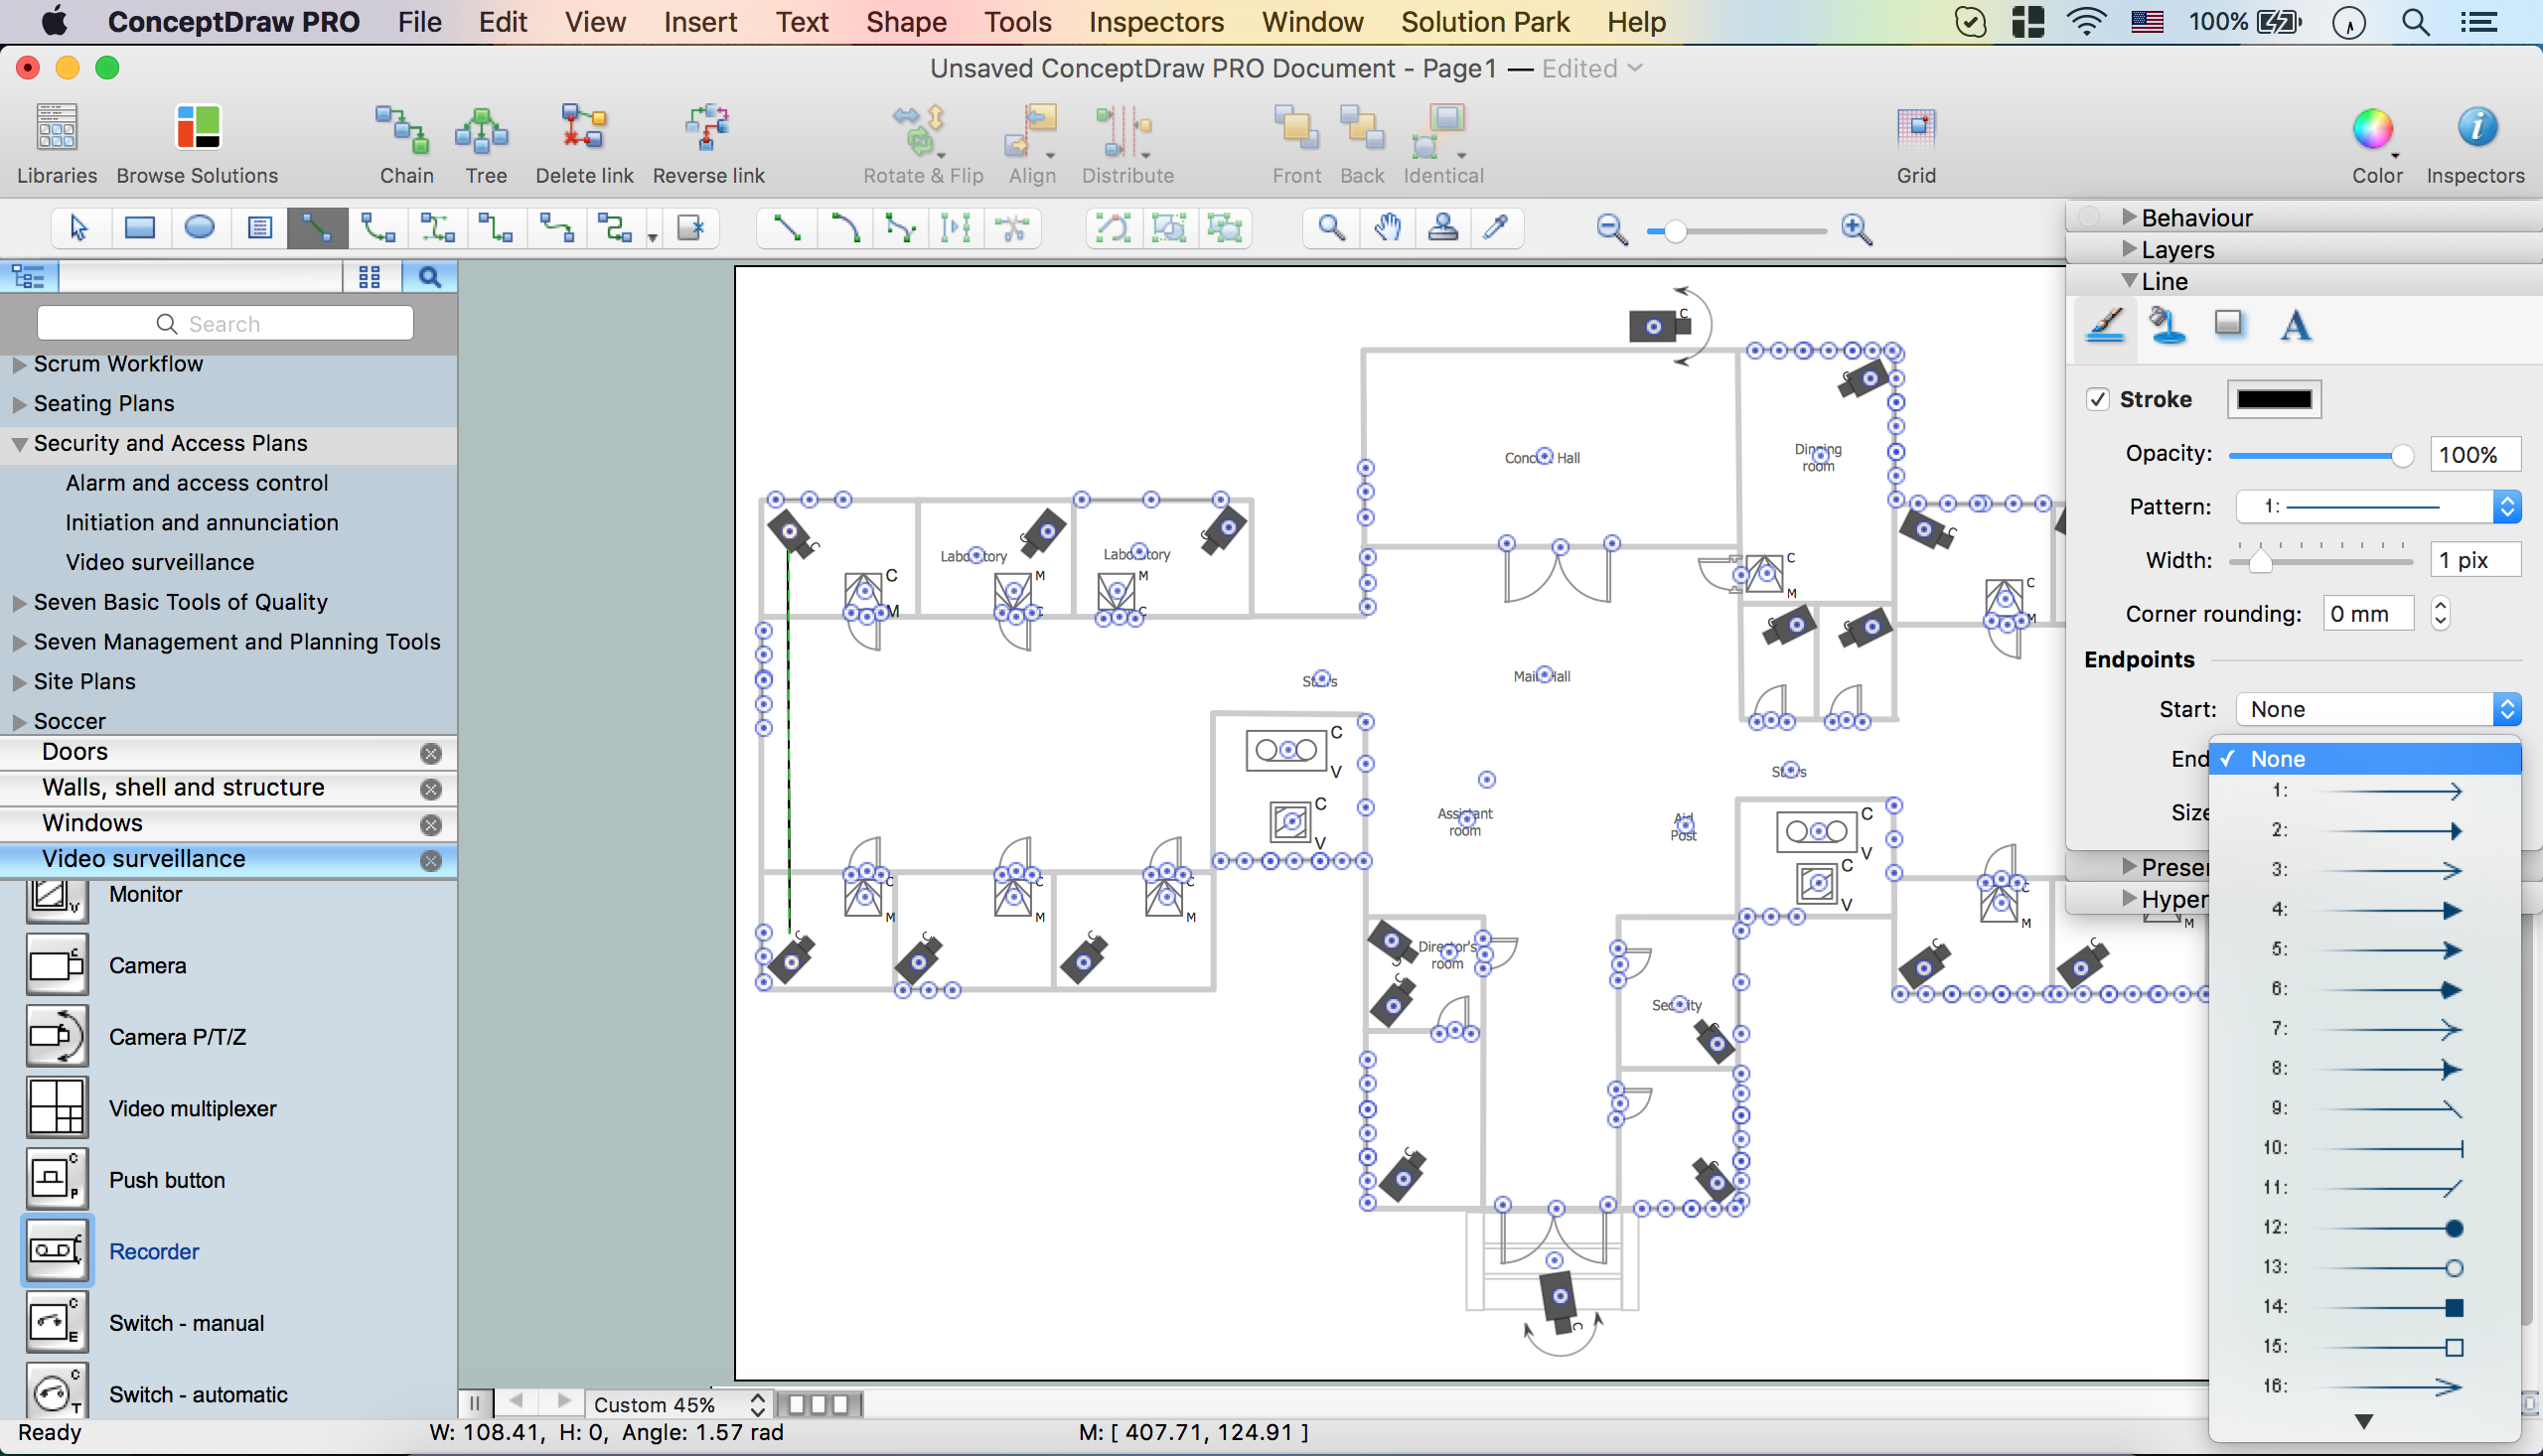
Picture: How To Create CCTV Network Diagram
Related Solutions:
Near field communication (NFC) is a wireless communication technology that allows smartphones and other similar devices to establish the radio communication with each other on the short distance around 10 centimeters (4 inches).
This example was created in ConceptDraw DIAGRAM using the Computer and Networks Area of ConceptDraw Solution Park and shows the Near field communication (NFC) network.
Picture: Near field communication (NFC). Computer and Network Examples
Related Solution:
Everyone wants to be efficient. To succeed, try Mind Maps for Business - SWOT Analysis and enjoy the result. But be careful: it can be addictive!
ConceptDraw products and supported by SWOT and TOWS Matrix Diagrams solution forms a great tool for providing SWOT analysis. The solution contains mind map templates. By filling mind map templates, one can easily determine Strengths, Weaknesses, Opportunities, and Threats of the current business. Just a one click is needed to turn the SWOT mind map into a SWOT matrix. The SWOT diagram will be created in ConceptDraw DIAGRAM on the base of SWOT mind map.
Picture: Mind Maps for Business - SWOT Analysis
A power station is an industrial facility for the generation of electric power. Most power stations contain one or more generators, a rotating machine that converts mechanical power into electrical power. The relative motion between a magnetic field and a conductor creates an electrical current. The energy source harnessed to turn the generator varies widely. Most power stations in the world burn fossil fuels such as coal, oil, and natural gas to generate electricity. Others use nuclear power, but there is an increasing use of cleaner renewable sources such as solar, wind, wave and hydroelectric.
26 libraries of the Electrical Engineering Solution of ConceptDraw DIAGRAM make your electrical diagramming simple, efficient, and effective. You can simply and quickly drop the ready-to-use objects from libraries into your document to create the electrical diagram.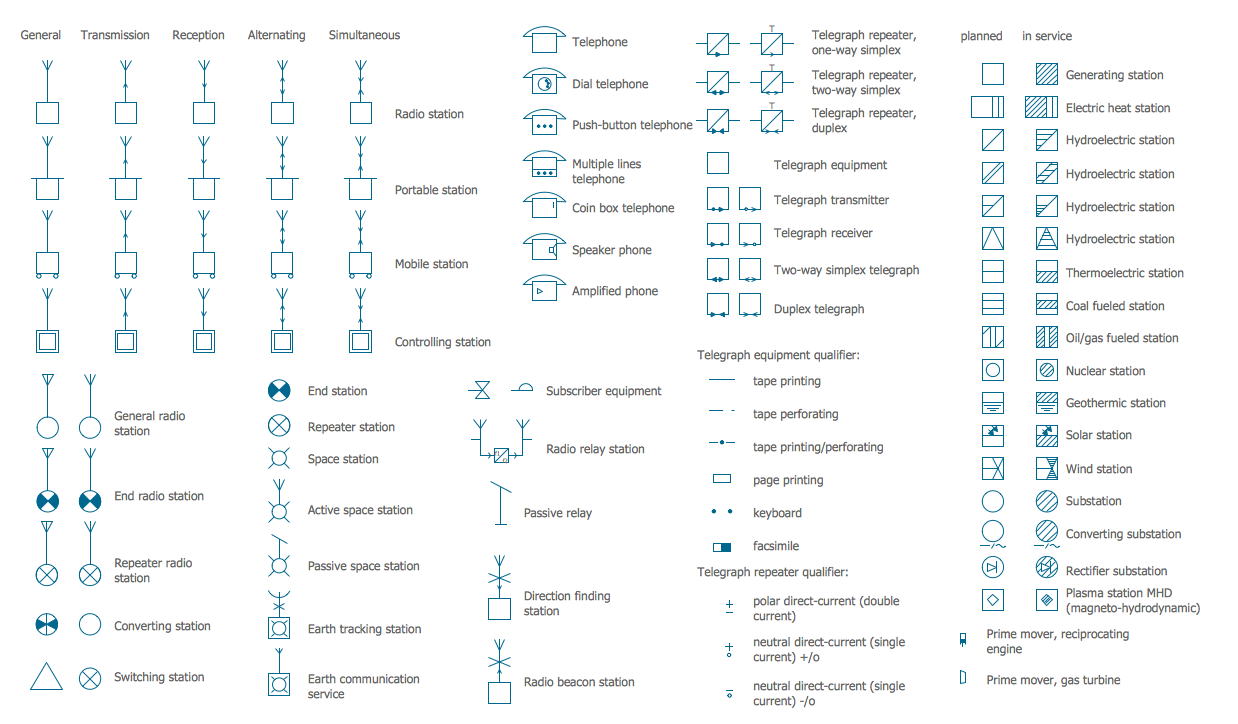
Picture: Electrical Symbols — Stations
Related Solution:
ConceptDraw Word Exchange solution gives you the ability to export mind maps to MS Word. It also allows stylizing the resulting document by using a custom MS Word template.
Picture: Export from ConceptDraw MINDMAP into MS Word Document
Chemical and Process Engineering solution contains variety predesigned process flow diagram elements relating to instrumentation, containers, piping and distribution necessary for chemical engineering, and can be used to map out chemical processes or easy creating various Chemical and Process Flow Diagrams in ConceptDraw DIAGRAM.
Picture: Process Flow Diagram Symbols
Related Solution:
UML Collaboration Diagram depicts the interactions between objects or parts in terms of sequenced messages and describes both the static structure and dynamic behavior of a system.
Rapid UML solution provides templates, examples and libraries of stencils for quick and easy drawing all the types of system and software engineering diagrams according to UML 2.4 and 1.2 notations.
Picture: UML Collaboration Diagram (UML2.0)
Related Solution:
This sample was created in ConceptDraw DIAGRAM diagramming and vector drawing software using the Computer and Networks solution from Computer and Networks area of ConceptDraw Solution Park.
A communication network topology is defined by the evaluating costs of the states. Each state represents the possible distribution of the hubs and remote nodes to nodes of the communication network.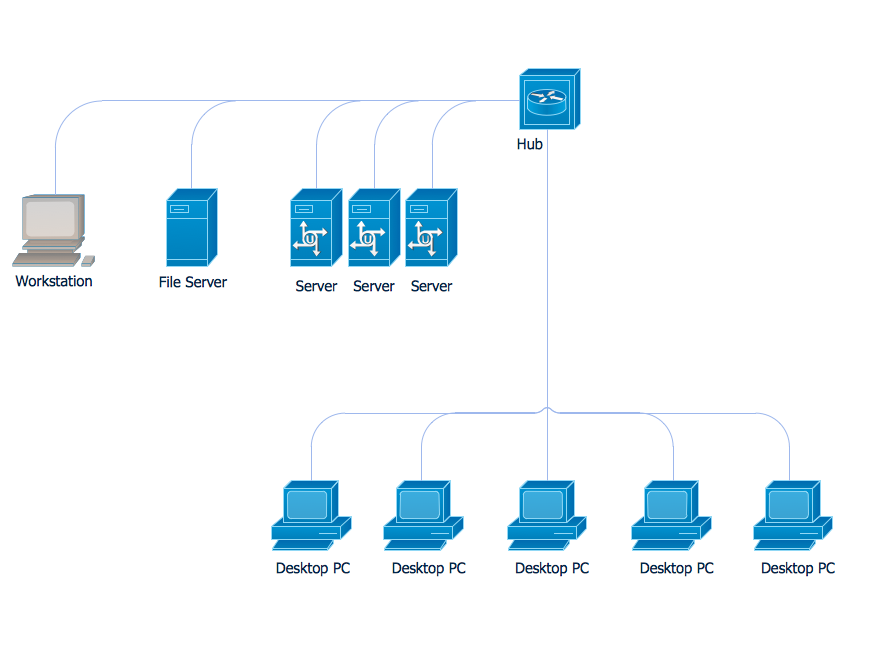
Picture: Communication Network Topology
Related Solution: