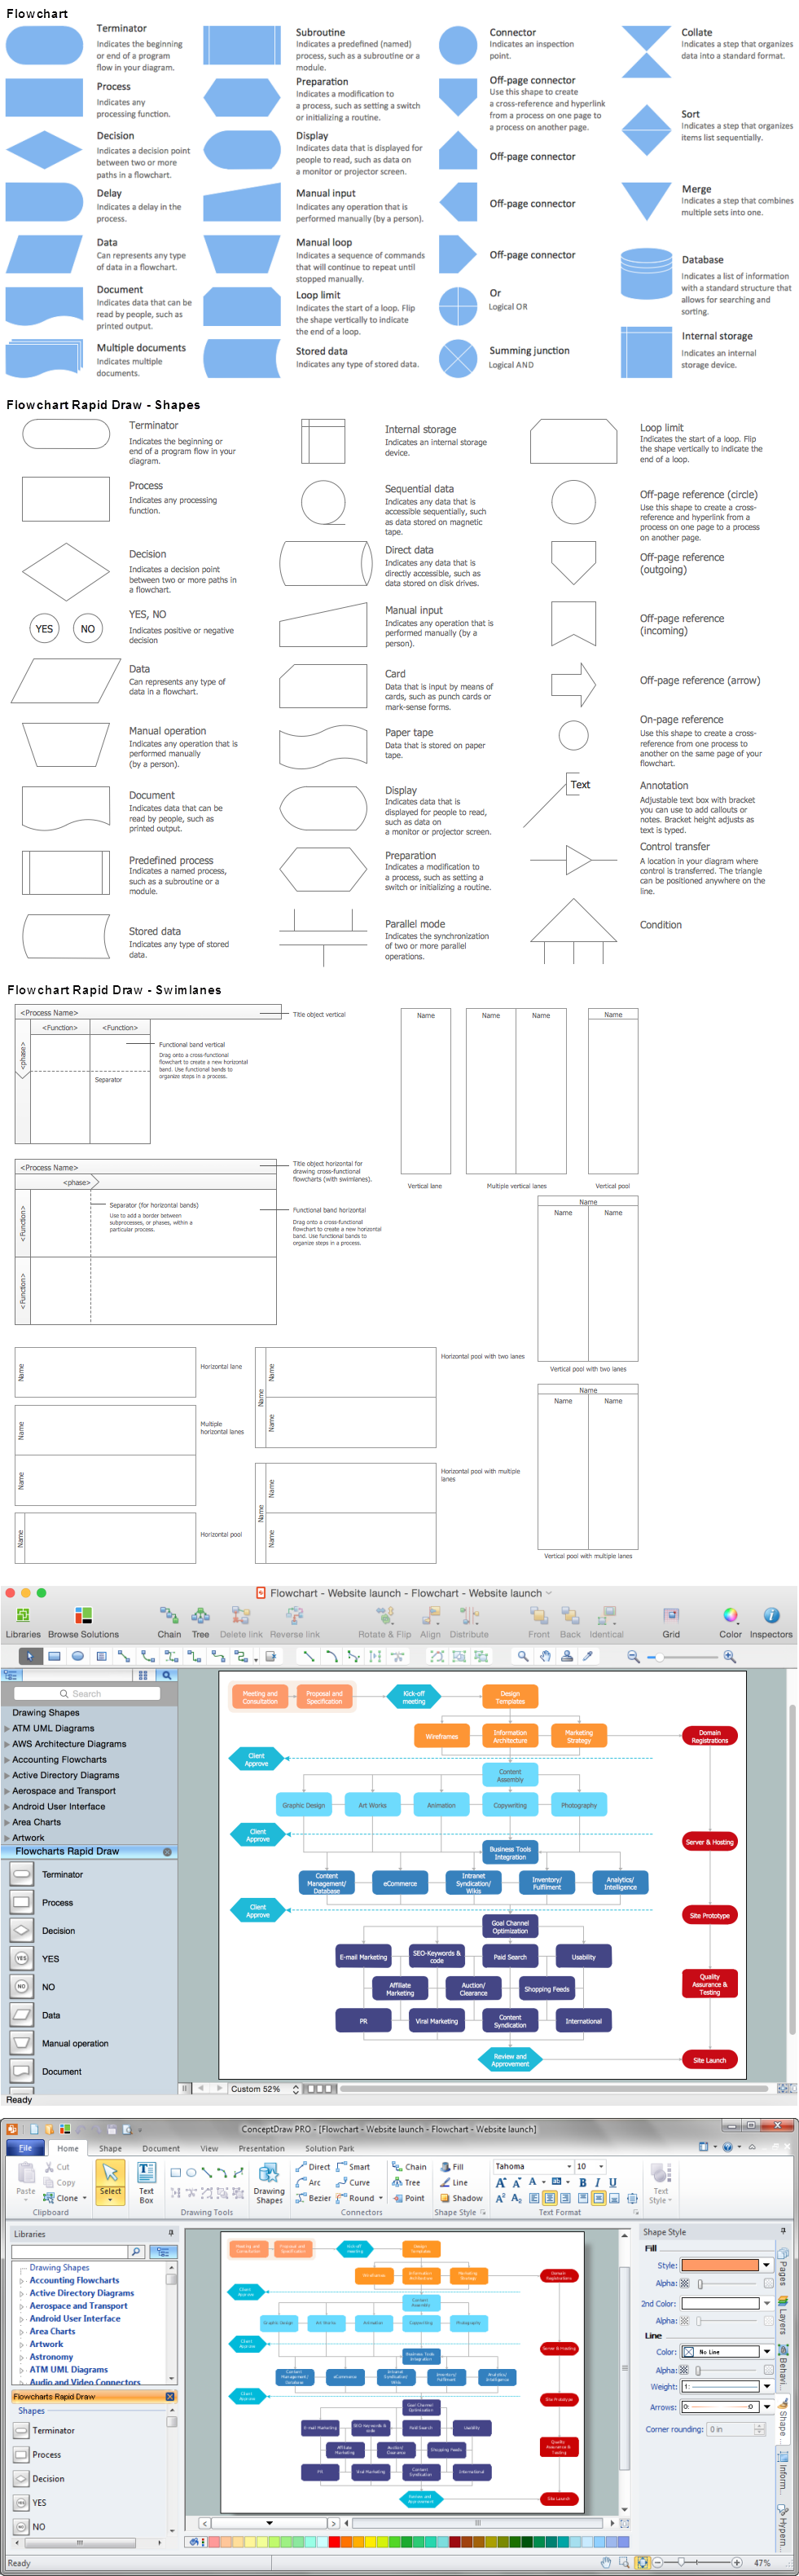
Example 1. Draw Flow Chart
Flowcharts Solution offers wide set of useful drawing tools, collection of samples, ready-to-use template and 2 libraries with predesigned vector elements:
- Flowchart
- Flowcharts Rapid Draw
which will help facilitate drawing process and designing professional looking Flow Charts. Draw Flow Chart of any complexity easy thanks to ConceptDraw DIAGRAM software!

Example 2. Flow Chart Example
Another way of drawing is to use ready template or sample. Use the ConceptDraw STORE to receive access to the samples included in Flowcharts solution. Click the desired preview in ConceptDraw STORE to open a corresponding document in ConceptDraw DIAGRAM

Example 3. Cross-Functional Flow Chart - Credit Approval Process
The Flow Charts you see on this page were created in ConceptDraw DIAGRAM software using the objects from the libraries of Flowcharts Solution. These samples successfully demonstrate solution's capabilities and professional results you can achieve. An experienced user spent 10 minutes creating each of them.
Use the Flowcharts Solution for ConceptDraw DIAGRAM Solution Park to draw Flow Chart of any complexity quick, easy and effective.
All source documents are vector graphic documents. They are available for reviewing, modifying, or converting to a variety of formats (PDF file, MS PowerPoint, MS Visio, and many other graphic formats) from the ConceptDraw STORE. The Flowcharts Solution is available for all ConceptDraw DIAGRAM or later users.
TEN RELATED HOW TO's:
Now it’s easy to share your visual documents with other people in a form most convenient for them.
ConceptDraw DIAGRAM can save your drawings and diagrams in a number of highly useful formats, including graphic files. You can save your drawing as a.PNG,.JPG, or other graphic format file.
Picture: Export from ConceptDraw DIAGRAM Document to a Graphic File
How to make a Concept Map fast and easy? ConceptDraw DIAGRAM diagramming and vector drawing software extended with Concept Maps Solution from the Diagrams Area is the best choice for those who want design professional looking Concept Map in minutes.
Picture: How To Make a Concept Map
Related Solution:
UML Interaction Overview Diagram schematically shows a control flow with nodes and a sequence of activities that can contain interaction or sequence diagrams.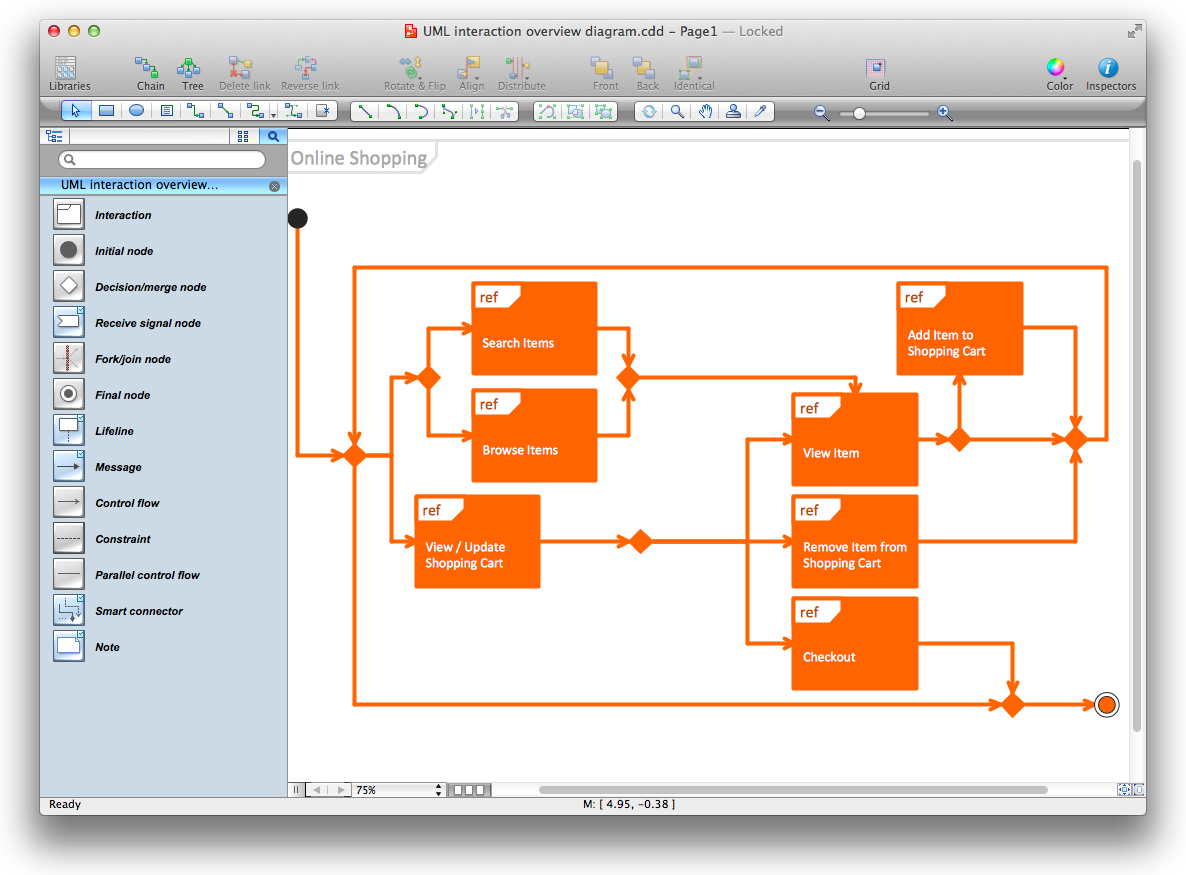
Picture: Diagramming Software for Design UML Interaction Overview Diagrams
The Total Quality Management Diagram solution helps your organization visualize business and industrial processes. Create Total Quality Management diagrams for business process with ConceptDraw software.
Picture: Definition TQM Diagram
Related Solution:
The Total Quality Management Diagram solution helps your organization visualize business and industrial processes. Create Total Quality Management diagrams for business process with ConceptDraw software.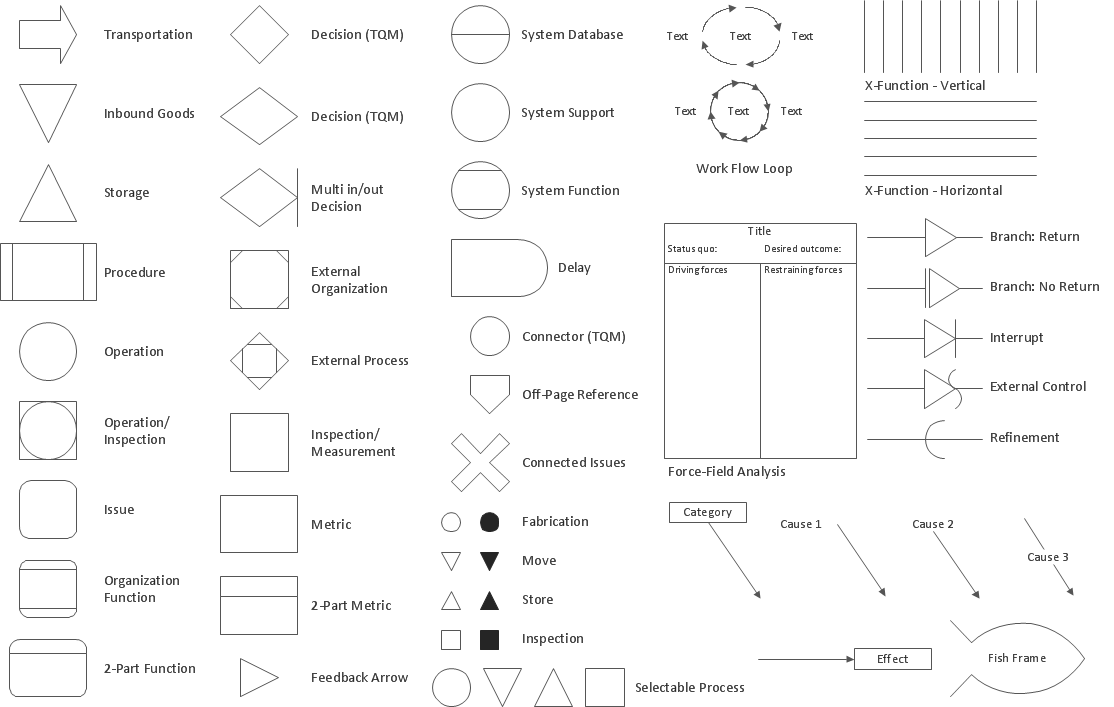
Picture: The Fifty Two Elements of TQM
Related Solution:
The Total Quality Management Diagram solution helps your organization visualize business and industrial processes. Create Total Quality Management diagrams for business process with ConceptDraw software.
Picture: Management Tools — Total Quality Management
Related Solution:
One of the ways effectively visualize what is a Cloud computing or Cloud computing architecture, is to create the Sequence diagram for Cloud computing. The ConceptDraw DIAGRAM diagramming and vector drawing software enhanced with Cloud Computing Diagrams solution from the Computers and Network area of ConceptDraw Solution Park will help you design all desired types of diagrams related with cloud computing.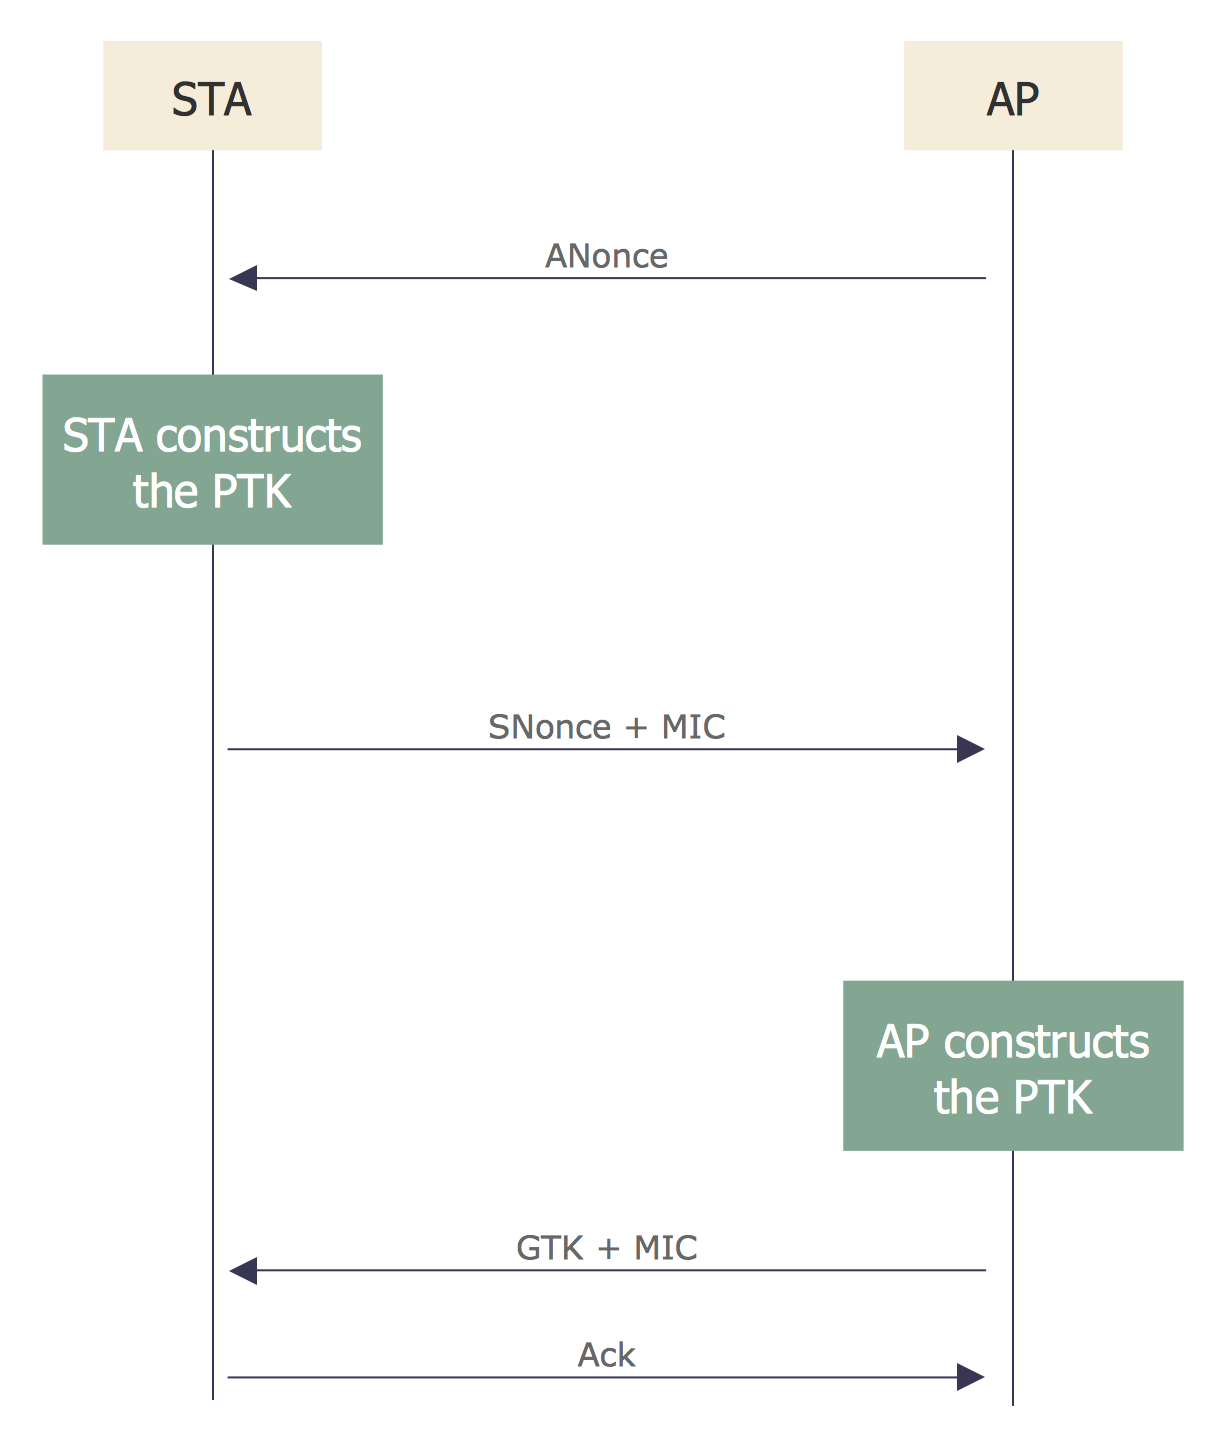
Picture: Sequence Diagram for Cloud Computing
Related Solution:
Data visualization is an important part of any software design. To understand how diagrams can improve your work, you can use examples of flowcharts that can be easily found on Internet. Flowcharts represent processes as sequences of steps written in appropriate symbols.
Launching a website is a complex process. There’s a lot to accomplish, and multiple people who need to participate. This flowchart can be helpful in planning and prioritizing tasks, making the process well-organized and clear for both developers and customers. This example flowcharts was build using ConceptDraw Flowcharts solution. It is really handy and helpful for starting any website project. It includes the set of milestones, and activities that can be easily customized and applied to any individual project.
Picture: Flowchart Design: Contoh Flowchart
Related Solution:
What is a Work Flow Chart? It is a chart which visually displays the step-by-step transferring of data, documents and tasks during the work. ConceptDraw DIAGRAM extended with Workflow Diagrams solution from the Business Processes area of ConceptDraw Solution Park is the best software for drawing the Work Flow Chart of any complexity.
Picture: Work Flow Chart
Related Solution:
Below you can see the symbol for pool table. You can find this symbol in the library of the Floor Plans Solution and use it in your floor plan of the sport complex, home, etc.
ConceptDraw DIAGRAM is a powerful diagramming and vector drawing software for creating the different Floor Plans. It’s very convenient, simple and quick to design the professional looking Floor Plans of any difficulty in ConceptDraw DIAGRAM.
Picture: Symbol for Pool Table for Floor Plans
Related Solution:

