Diagramming software for Amazon Web Service
icon set: Monitoring, Deployment, Management
ConceptDraw DIAGRAM is universal diagramming software extended with ConceptDraw Solution Park’s solution for AWS Architecture diagramming.
The Set of AWS icons includes: Application Services, Compute, Data Base, Groups, Monitoring and Deployment and Management, Networking and Content Delivery, Non Service Specific, Storage. For more details learn AWS Solution in ConceptDraw Solution Park.
Icon set: "Monitoring, Deployment, Management" See also:
Diagramming software for Amazon Web Service
Diagrams, charts, schemes, symbols and icons
AWS Simple Icons for Architecture Diagrams
Diagramming for Amazon Web Services architecture - Design Elements and Icons
Samples
Network Diagrams — AWS Architecture
TEN RELATED HOW TO's:
In software engineering, it is important to understand how the system would cooperate with external sources, like data sources. To give this information a visual representation, data flow diagrams (DFD) were used for years. The entire system is usually divided into smaller ones, and all of them process data flows in appropriate ways.
The visualizing business processes which engages the data transfer, is commonly preformed using DFDs (data flow diagrams). DFD is used to show the data flow processing and transformation. This DFD represents the electronic system of a customer purchase. It was created using Gane/Sarson notation. Data flow diagrams helps you to sort through and clarify transferring process making it available for analysis, and representation. ConceptDraw DFD solution introduces the vector library, containing the full set of icons from DFD notations.
Picture: Data Flow Diagram (DFD)
Related Solution:
Wireless computer network diagrams help system administrators and network engineers to find out amount and type of equipment needed for each office LAN.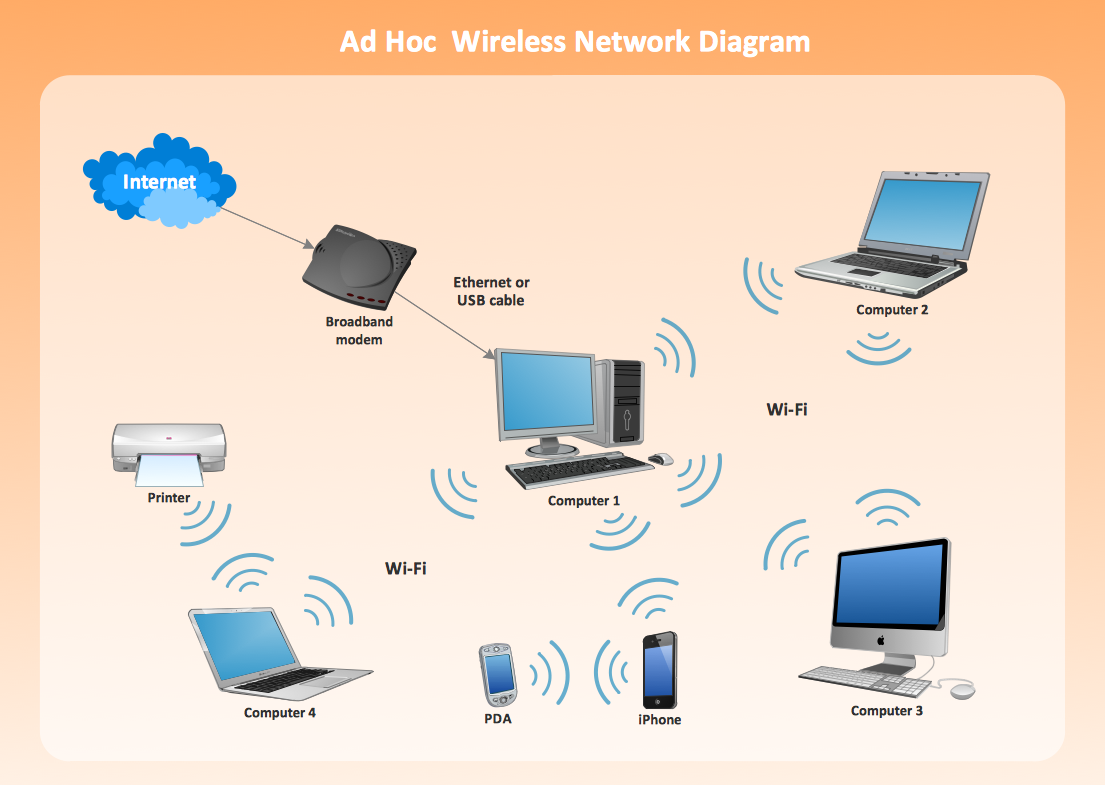
Picture: Wireless Network LAN
Related Solution:
UML Component Diagram illustrate how components are wired together to larger components and software systems that shows the structure of arbitrarily complex systems.
ConceptDraw Rapid UML solution delivers libraries contain pre-designed objects fit UML notation, and ready to draw professional UML Component Diagram.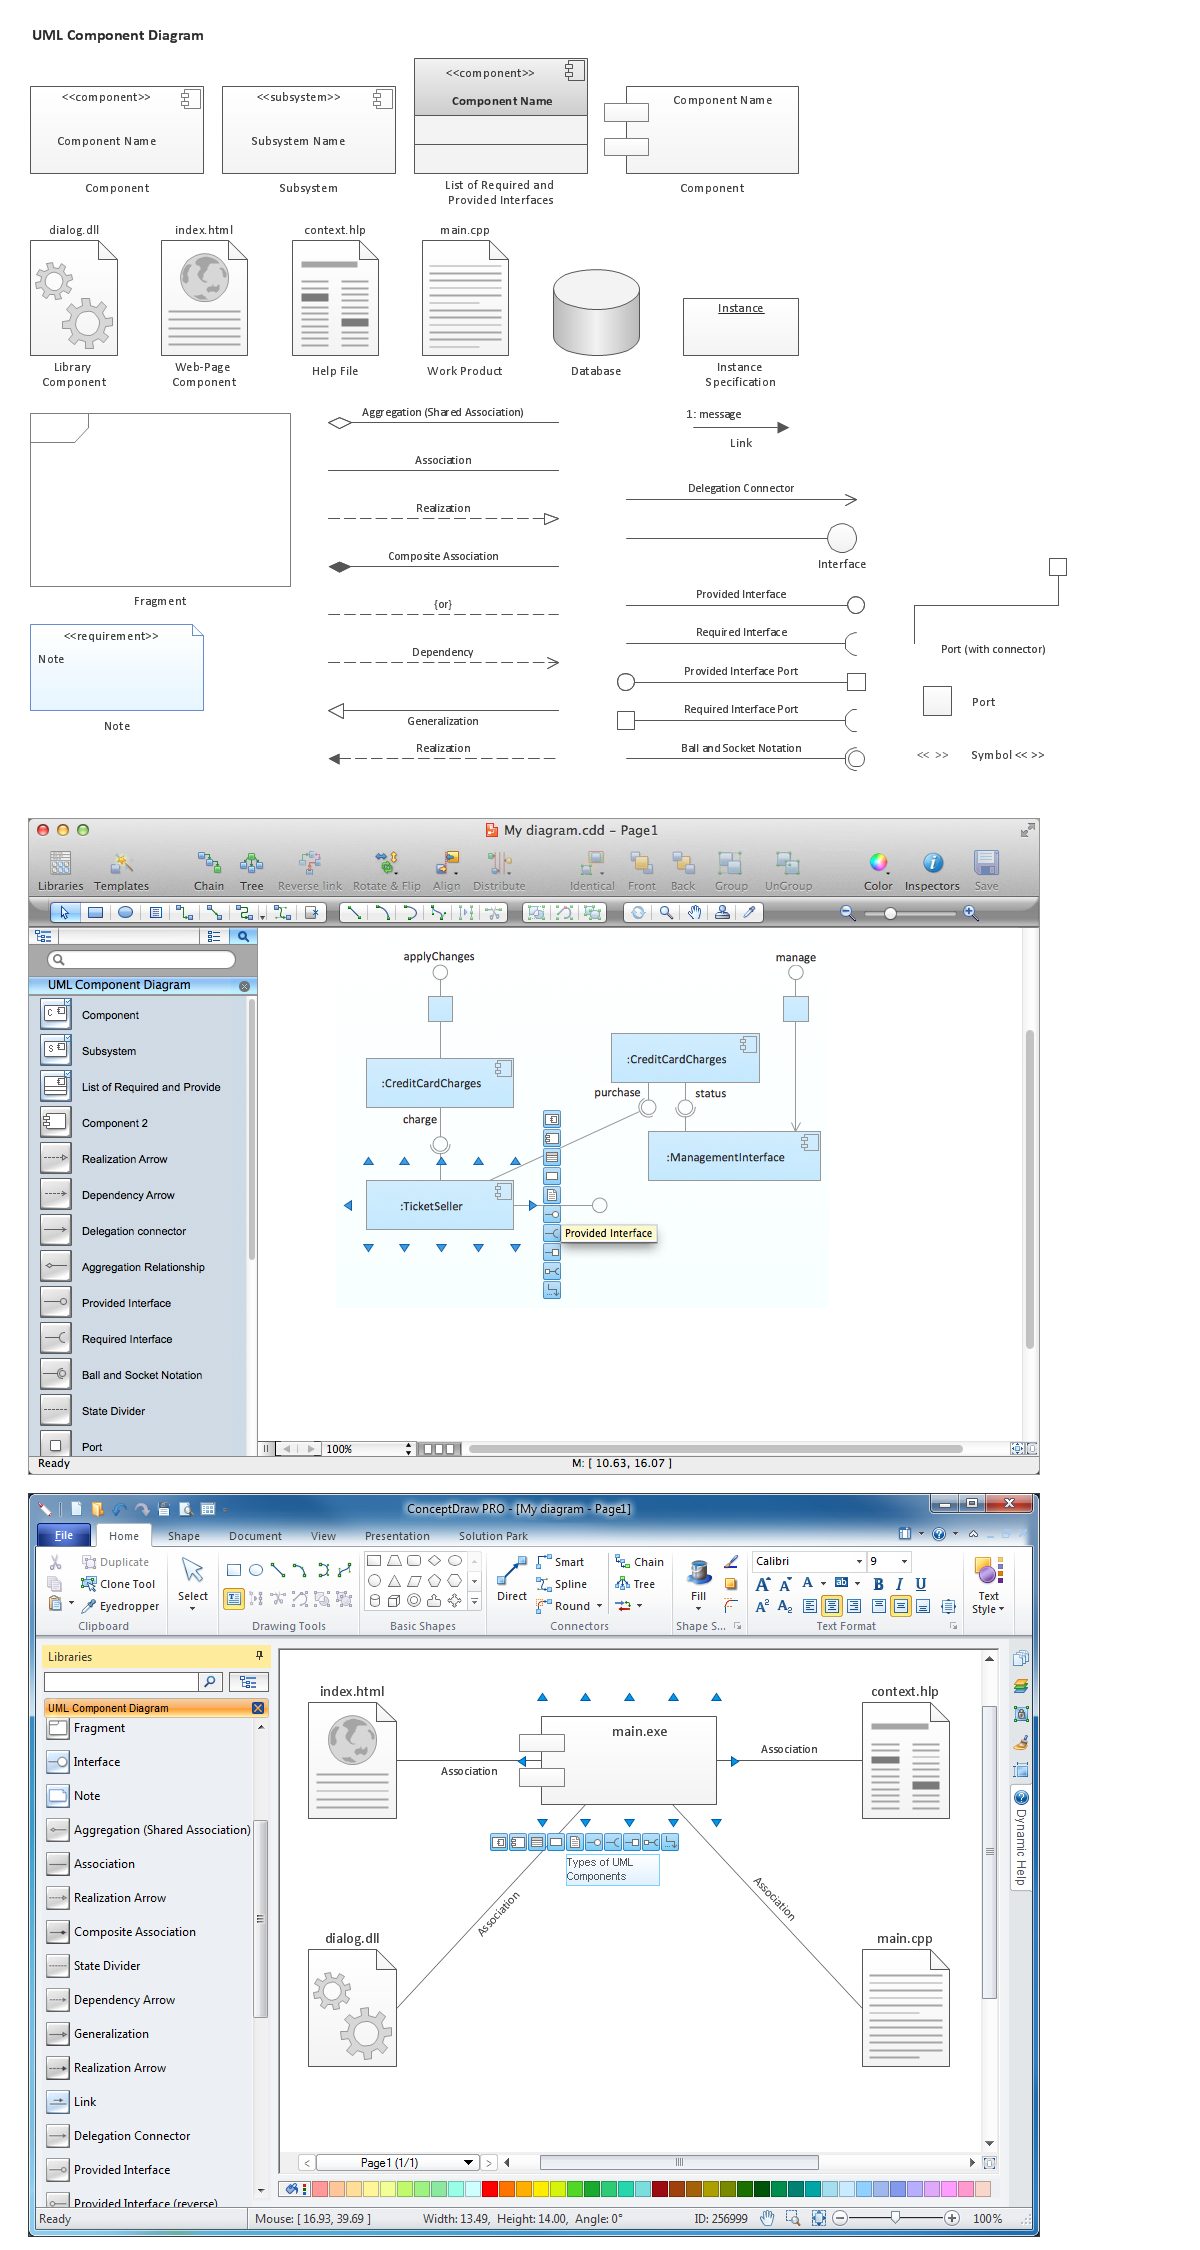
Picture: Diagramming Software for Design UML Component Diagrams
Related Solution:
The VMware vNetwork Distributed Switch (vDS) is the new virtual switch (vSwitch) with vSphere 4 that extends the set of features of the VMware vNetwork Standard Switch (vSS). The VMware vSS is the base-level virtual networking alternative that extends the capabilities, configuration and appearance of the standard vSwitch in VMware ESX 3.5 to ESX 4.0 and vSphere 4.
This example was created in ConceptDraw DIAGRAM using the Computer and Networks Area of ConceptDraw Solution Park and shows the VMware vDS network diagram.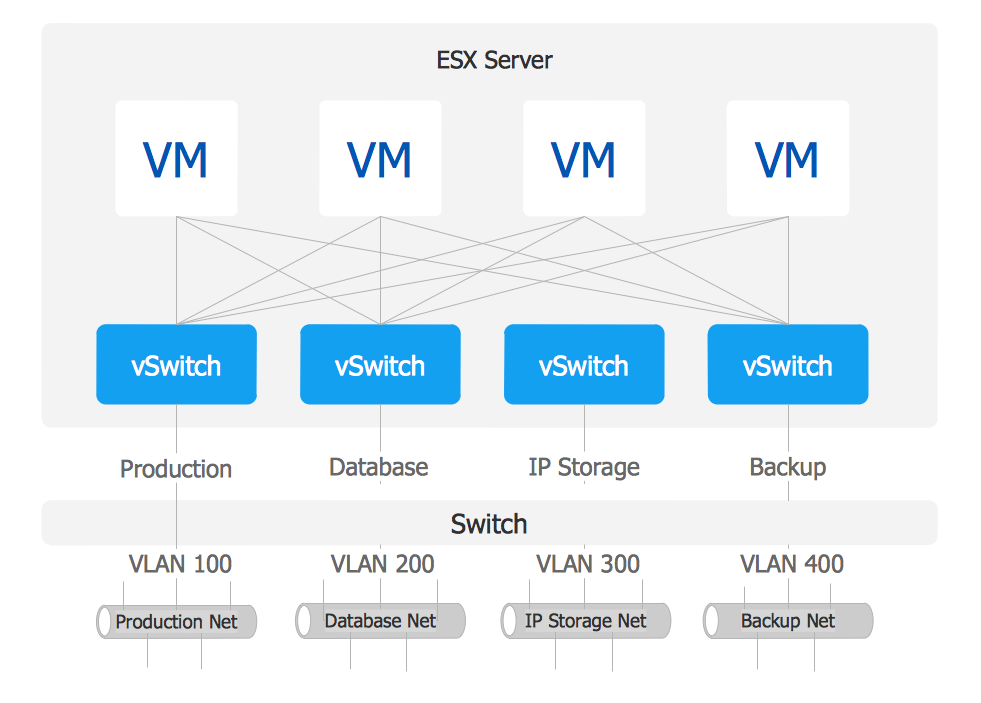
Picture: VMware vNetwork Distributied Switch (vDS). Computer and Network Examples
Related Solution:
The ConceptDraw vector stencils library Cisco Multimedia, Voice, Phone contains equipment symbols for drawing the computer network diagrams.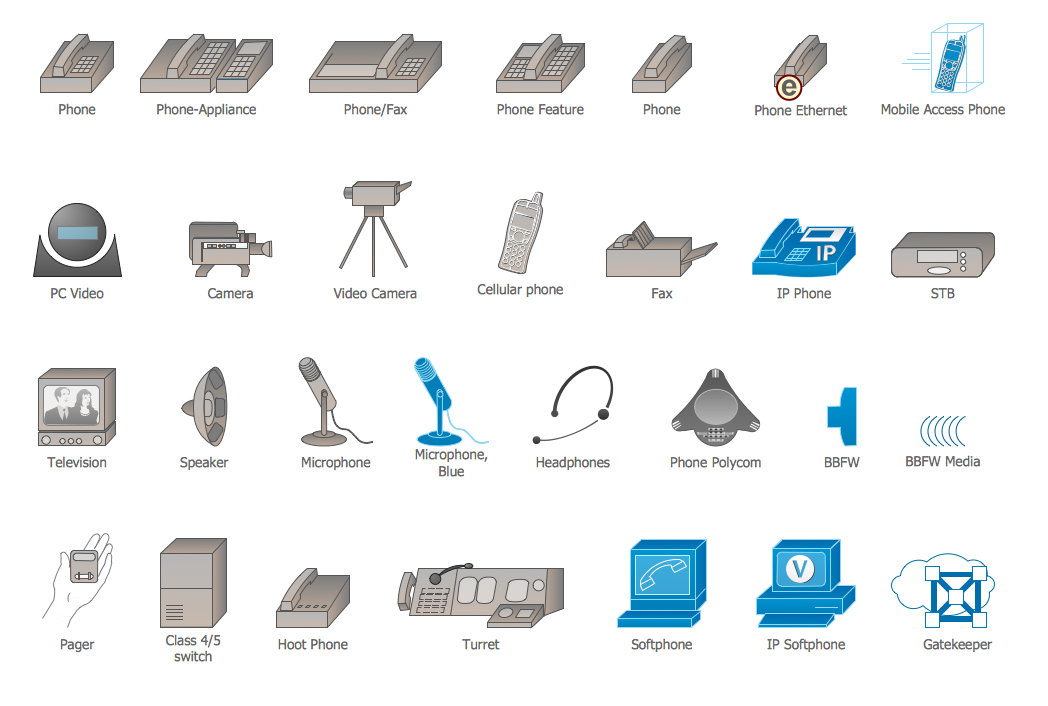
Picture: Cisco Multimedia, Voice, Phone. Cisco icons, shapes, stencils and symbols
Related Solution:
ConceptDraw DIAGRAM is perfect for software designers and software developers who need to draw Computer&Network Diagrams.
ConceptDraw has 1004 vector stencils in the 40 libraries that helps you to start using software for designing own Network Diagrams. You can use the appropriate stencils from Computer and Network Diagrams library with 56 objects..png)
Picture: Design Element: Computer and Networkfor Network Diagrams
Related Solution:
ConceptDraw DIAGRAM is the only application on the Macintosh platform, supplied with a comprehensive Cisco icon set. For graphic solutions that support Windows, only Microsoft Visio has a library of Cisco shapes. ConceptDraw DIAGRAM is a valuable option to many network professionals that use Macintosh computers or work in a combined Mac and PC environment.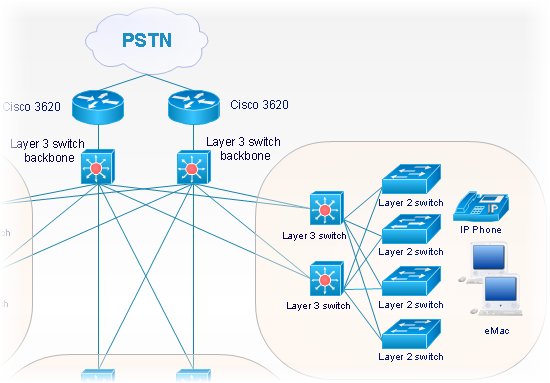
Picture: Cisco Network Objects in ConceptDraw DIAGRAM
ConceptDraw DIAGRAM is a professional diagramming and vector drawing software. Now, enhanced with SysML Solution from the Software Development Area of ConceptDraw Solution Park, ConceptDraw DIAGRAM became an ideal software for model based systems engineering (MBSE).
Picture: Model Based Systems Engineering
Related Solution:
ConceptDraw DIAGRAM extended with ATM UML Diagrams Solution from the Software Development Area of ConceptDraw Solution Park is a powerful software for representing the ATM processes, for designing and building banking system and ATMs.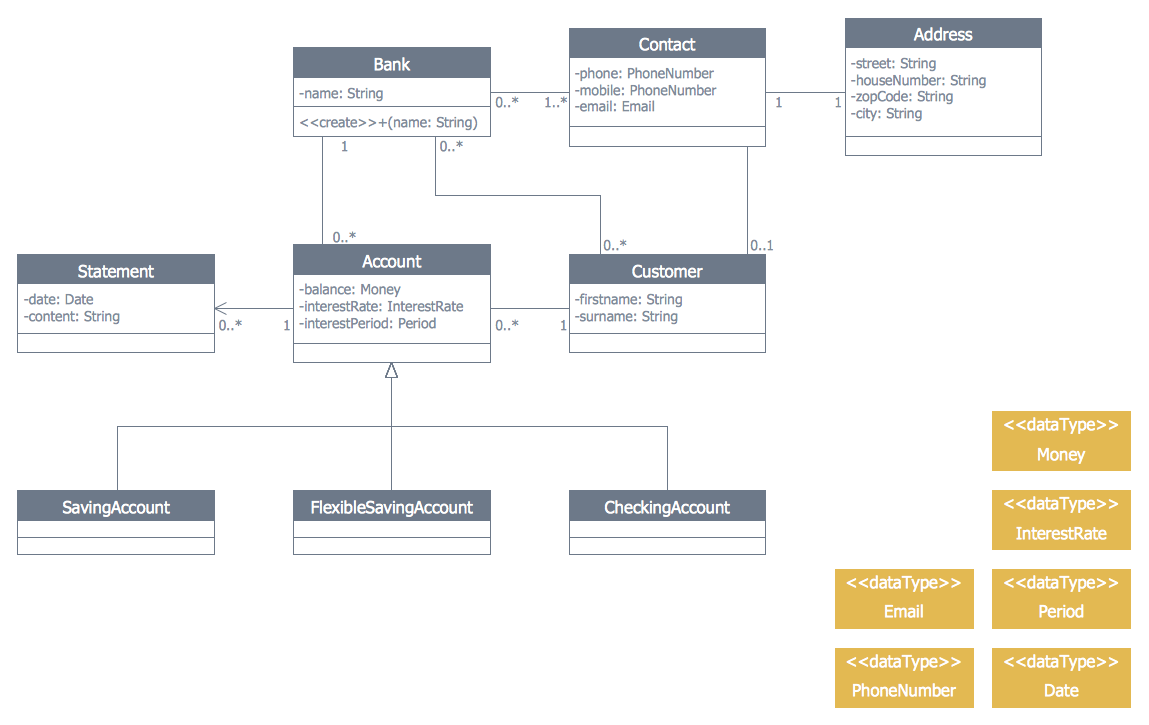
Picture: Banking System
Related Solution:
Appplication Services icons - Amazon AWS pro diagrams - AWS diagrams are part of architecturing tools provided with ConceptDraw Solution Park.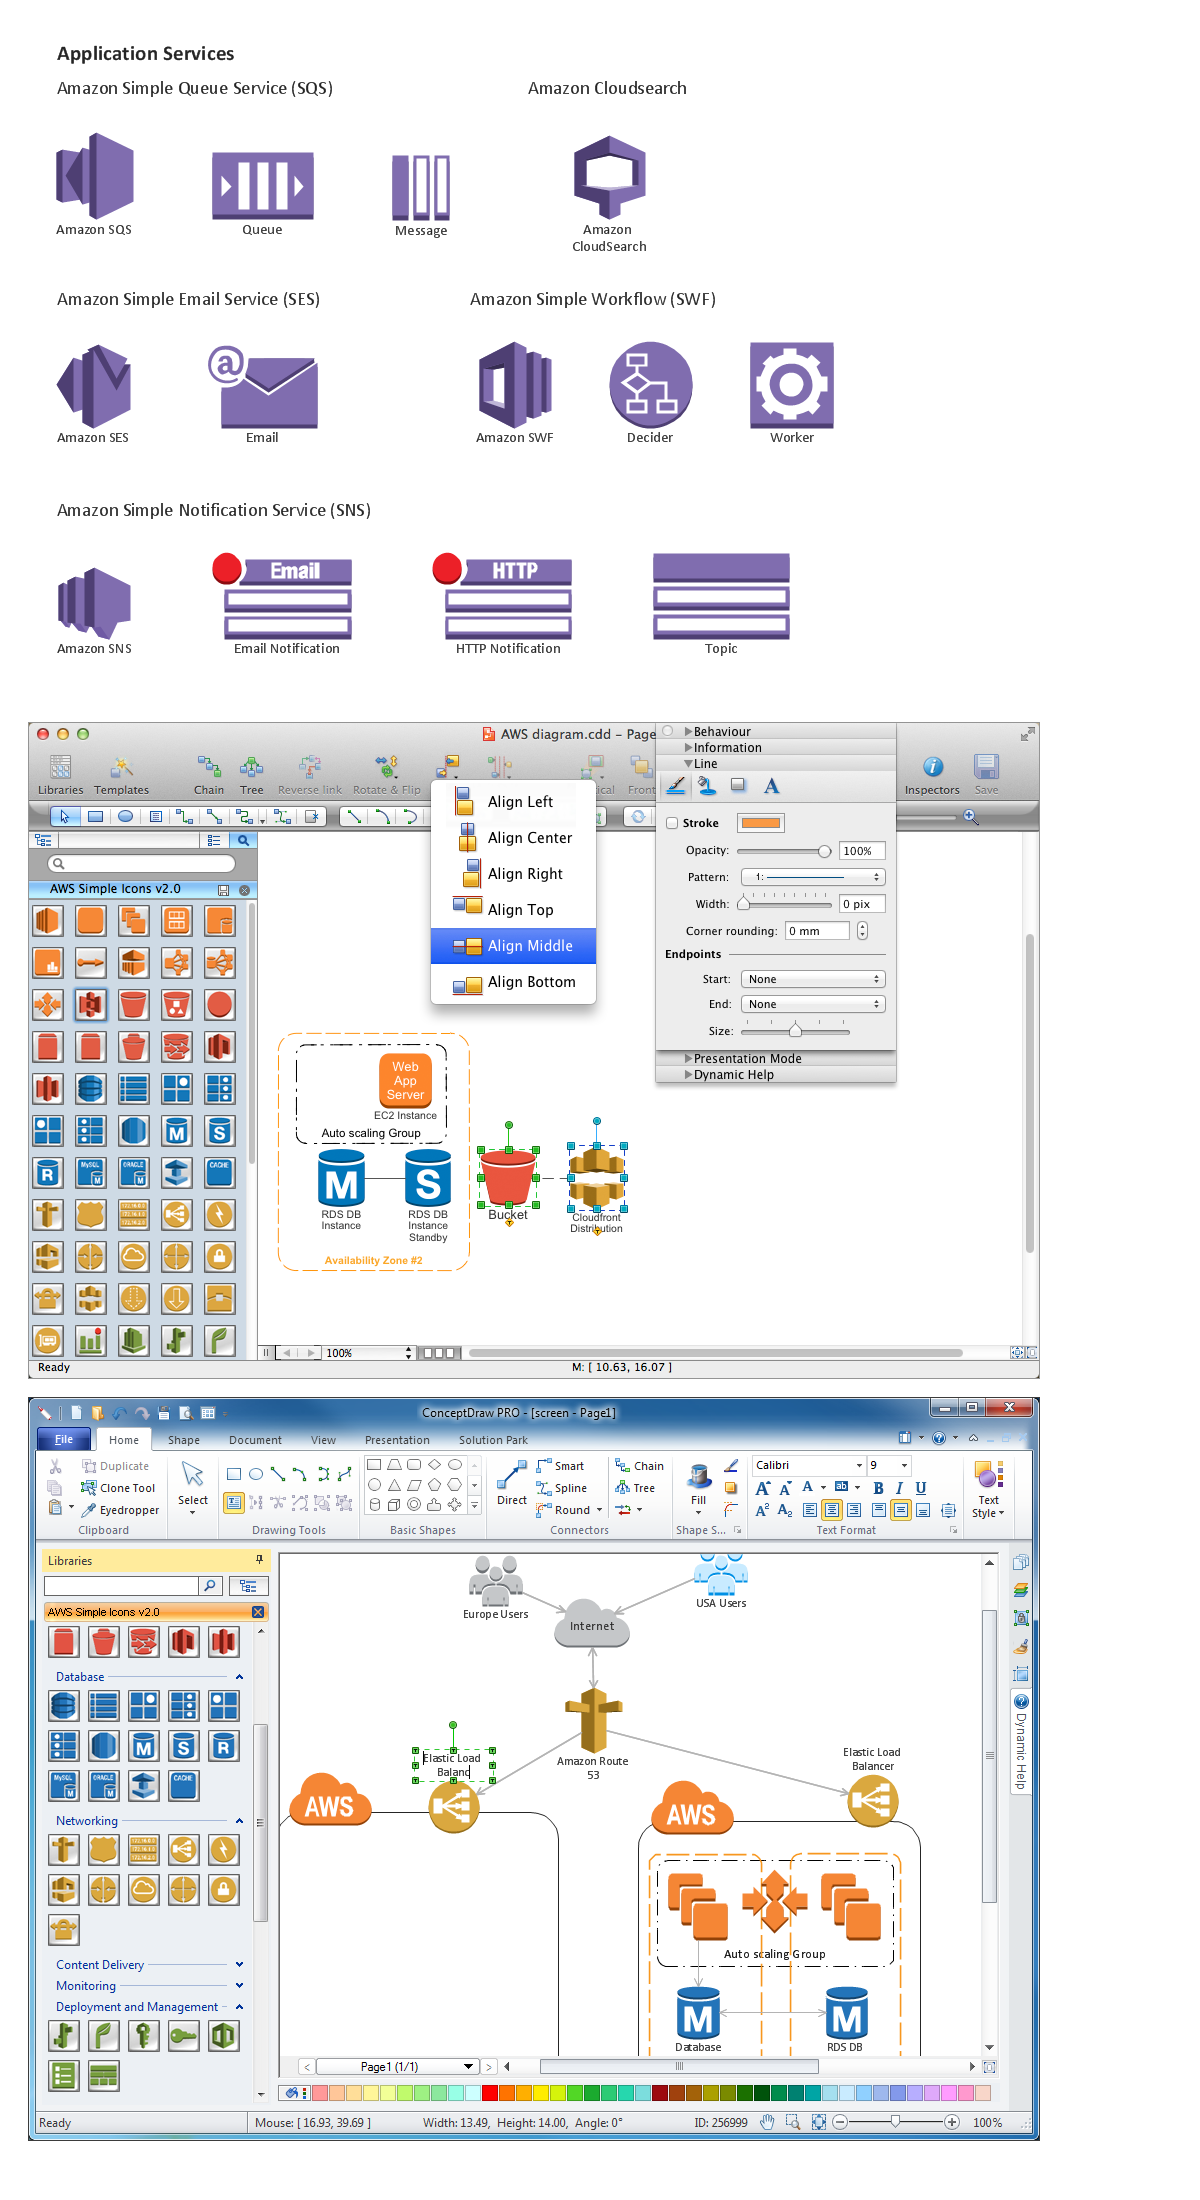
Picture: Diagramming software for Amazon Web Service icon set: Application Services
ConceptDraw
DIAGRAM 18