Rapid UML
This solution extends ConceptDraw DIAGRAM software with the ability to develop UML diagrams as quickly as the ideas come.
The solution uses ConceptDraw RapidDraw techniques. The result is a vector graphic document.
-
Install this solution Free -
What I need to get started -
Solution Requirements - This solution requires the following products to be installed:
ConceptDraw DIAGRAM v18 - This solution requires the following products to be installed:
-
Compatibility - Sonoma (14), Sonoma (15)
MS Windows 10, 11 - Sonoma (14), Sonoma (15)
-
Support for this Solution -
Helpdesk
Design Element
13 libraries 393 objects from UML
Related News:
Examples
There are a few samples that you see on this page which were created in the ConceptDraw DIAGRAM application by using the Rapid UML solution. Some of the solution's capabilities as well as the professional results which you can achieve are all demonstrated here on this page.
All source documents are vector graphic documents which are always available for modifying, reviewing and/or converting to many different formats, such as MS PowerPoint, PDF file, MS Visio, and many other graphic ones from the ConceptDraw Solution Park or ConceptDraw STORE. The Rapid UML solution is available to all ConceptDraw DIAGRAM users to get installed and used while working in the ConceptDraw DIAGRAM diagramming and drawing software.
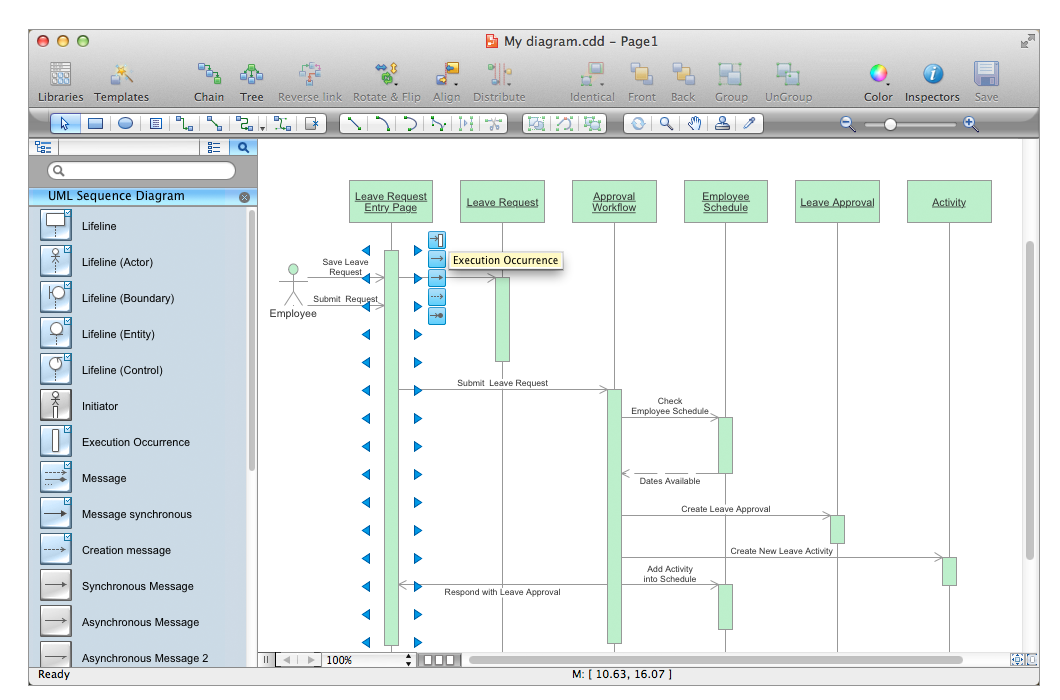
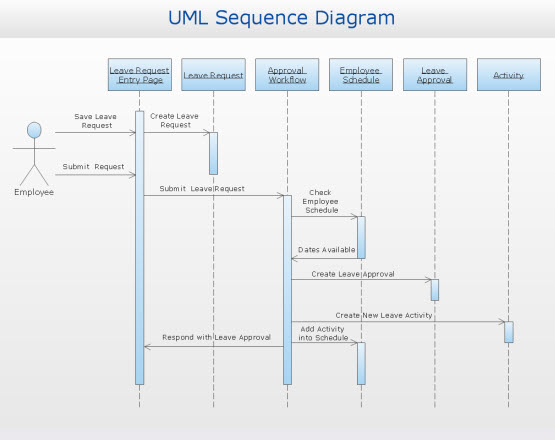
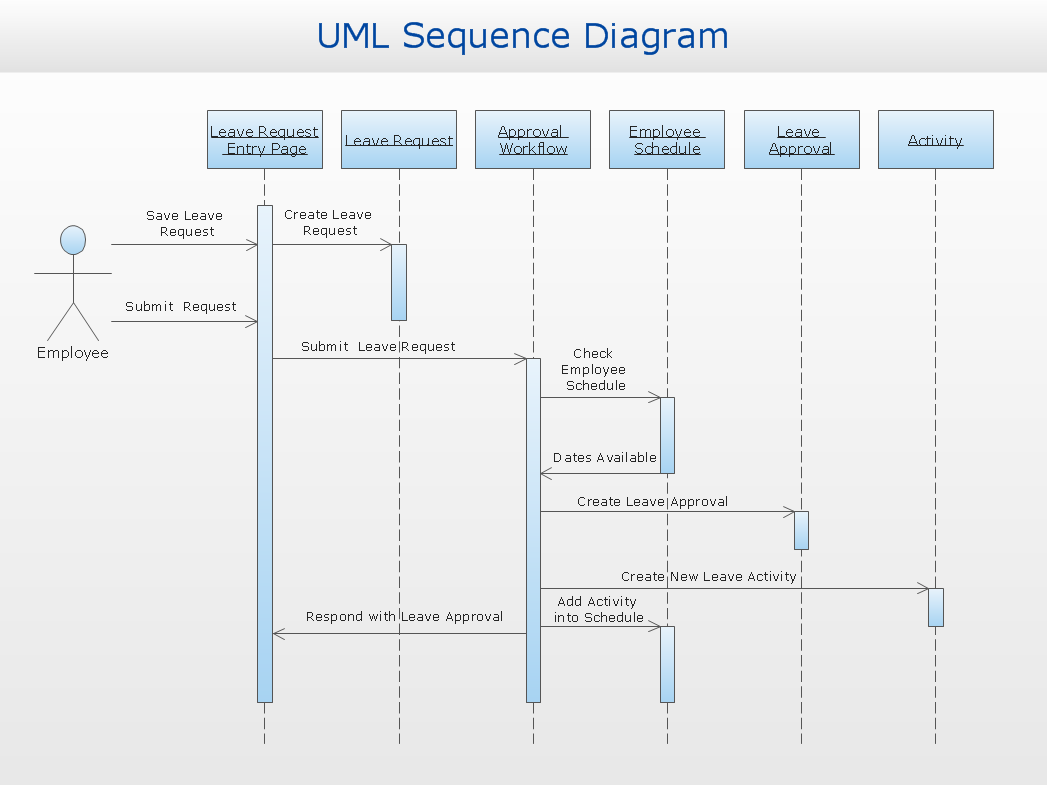
Example: UML Sequence Diagram — Checking Process
This diagram was created in ConceptDraw DIAGRAM using the UML Sequence Diagram library from the Rapid UML solution. An experienced user spent 10 minutes creating this sample.
When you want to take a well-earned break from work, a checking process needs to be performed. This map helps you create a formal checking process that can be used universally.

More Examples and Templates

.png)
Inside

What I Need to Get Started
ConceptDraw DIAGRAM and the Rapid UML solution found in the Universal Diagramming Area of ConceptDraw Solution Park are all you need to get started. Make sure both are installed on your computer.
How to install
Download and install ConceptDraw STORE and ConceptDraw DIAGRAM. Next install the “Rapid UML” solution using ConceptDraw STORE.
Start Using
To make sure that you are doing it all right, use the pre-designed symbols from the stencil libraries from the solution to make your drawings look smart and professional. Also, the pre-made examples from this solution can be used as drafts so your own drawings can be based on them. Using the samples, you can always change their structures, colors and data.

About
Benefits: The Rapid UML Solution allows you to swiftly develop any type of UML diagram, because of its simple and intuitive interface.
Objective: Provide a RapidDraw-based set of templates and objects to instantaneously create UML diagrams in a quick and intuitive manner.
Solution Purpose: To create elegant, professional-looking UML diagrams quickly and efficiently.
Intended For: System architects, software developers, system analysts, business analysts.
Products and Methods: To make use of the built-in RapidDraw functionality, we have created a whole new set of solutions for you— an extensive set of pre-designed objects, libraries, templates and samples let the user’s ideas burst onto the page as never before.
ConceptDraw PRO Rapid UML Solution
Working on a problem has two important phases. In the first, you generate ideas, formulate words, and find the solution. In the second phase, you present your results in a meaningful way. This second phase is often just as time consuming as the first, if not more so. You waste time finding tools, then learning to use them, then creating the necessary assets, connecting them in a single diagram, and so on. It would seem easier to just sketch by hand, because you can draw at about the same speed your thoughts flow. Professional audiences expect more than just a napkin sketch, so reproducing your drawing for presentation would just take more time.
Is it possible to create professional quality diagrams at the speed of thought? Thanks to ConceptDraw, the answer is a resounding, «Yes!» CS Odessa has a series of Solutions, available through the ConceptDraw Solution Park, that utilize the RapidDraw feature in ConceptDraw DIAGRAM to create diagrams quicker than ever before. The first to debut is the Rapid UML Solution, containing objects specifically for use in UML diagrams commonly employed by software architects and systems analysts. No longer will you have to waste even a minute planning your drawings. Once you think through the process, you can immediately create ready-to-use, ready-to-print, and ready-to-present diagrams that can also be exported to a variety of formats such as PDF, PowerPoint, and more.
Rapid UML Solution Overview
This is a quick overview of the diagrams included in the Rapid UML solution for ConceptDraw DIAGRAM and their purposes.
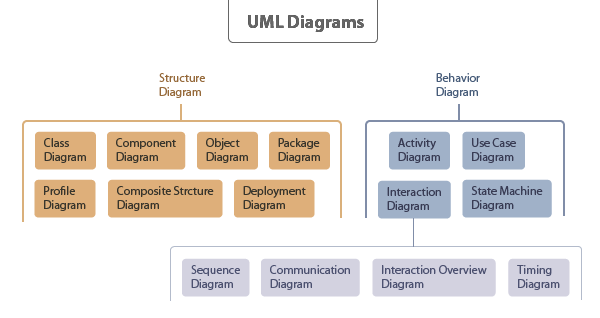
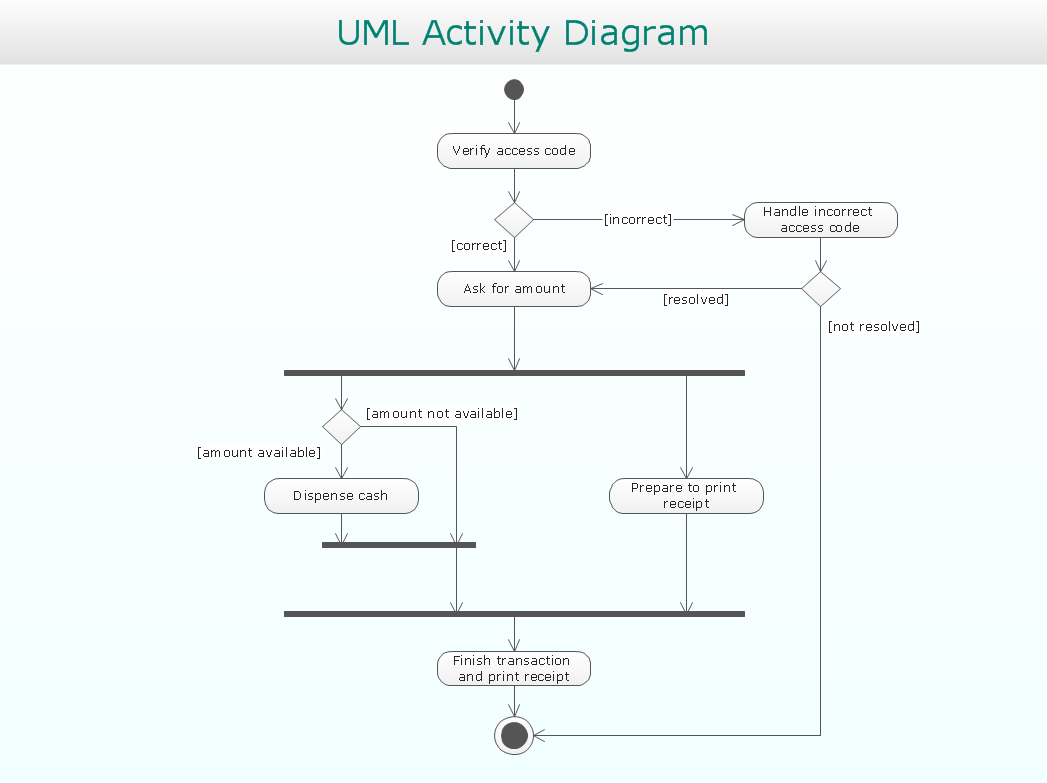
- An Activity Diagram shows the steps involved in forming a complex process such as a computational algorithm, technological process, or business process. This type of diagram shows the flow of attention, focusing on operations rather than objects. Activity Diagrams are designed to clarify use-case and sequence models. This diagram is recommended in the early stages of design.

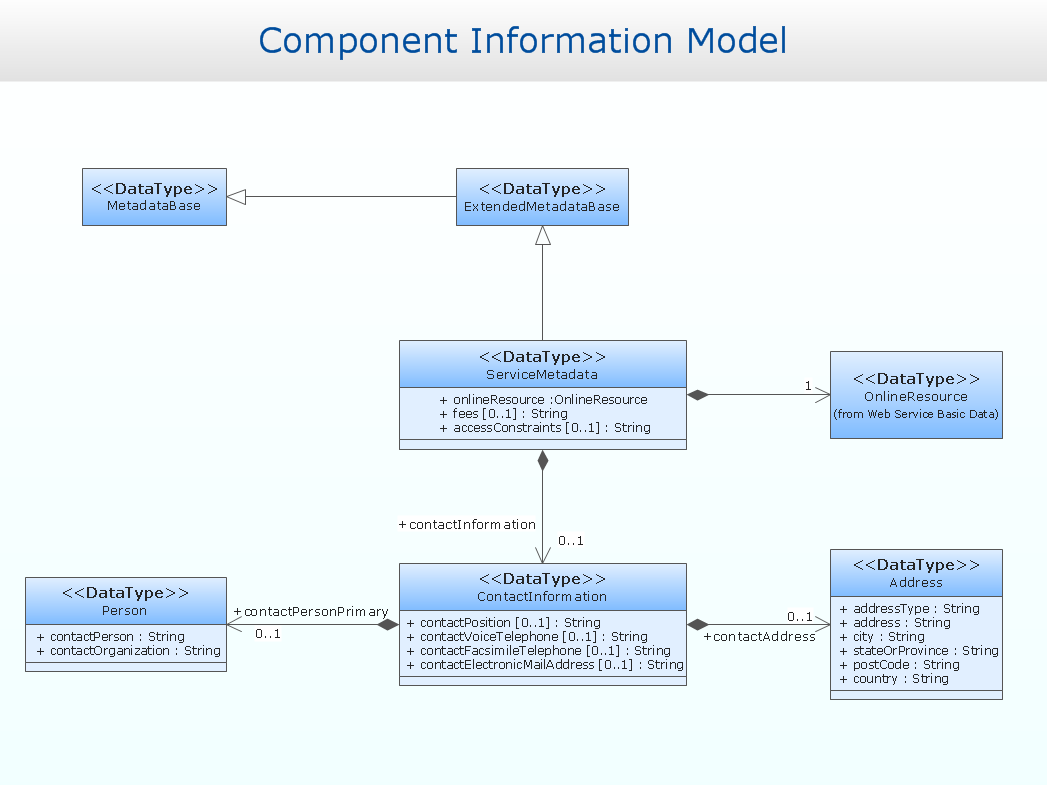
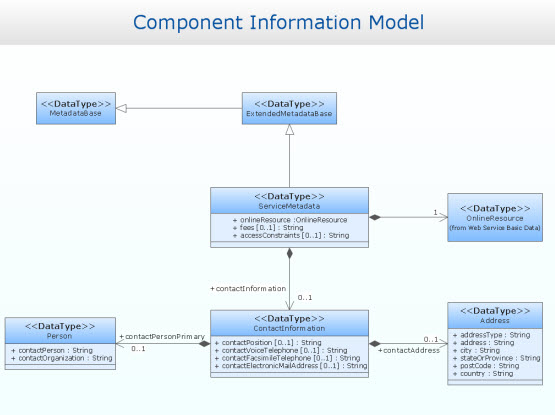
- Class Diagrams allow us to describe the model of classes and their relationships. It is useful for abstract modeling and the design of specific programs. Class Diagrams are most commonly used to display the structure of the application.
- The Sequence Diagram is a graphical representation of a text script. It shows the participants of an interaction and the sequence of messages they exchange. Sequence Diagrams describe the system’s interaction with users in the process of full or partial implementation of one use case.
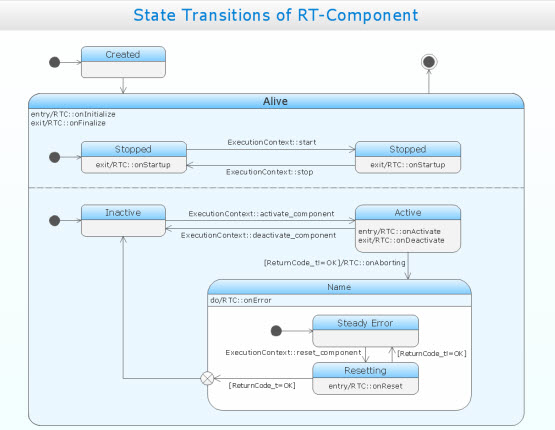
- A State Machine Diagram is a graph in which the nodes are states and directed arcs are the transitions between states. The diagram describes the sequence of states caused by a sequence of events.
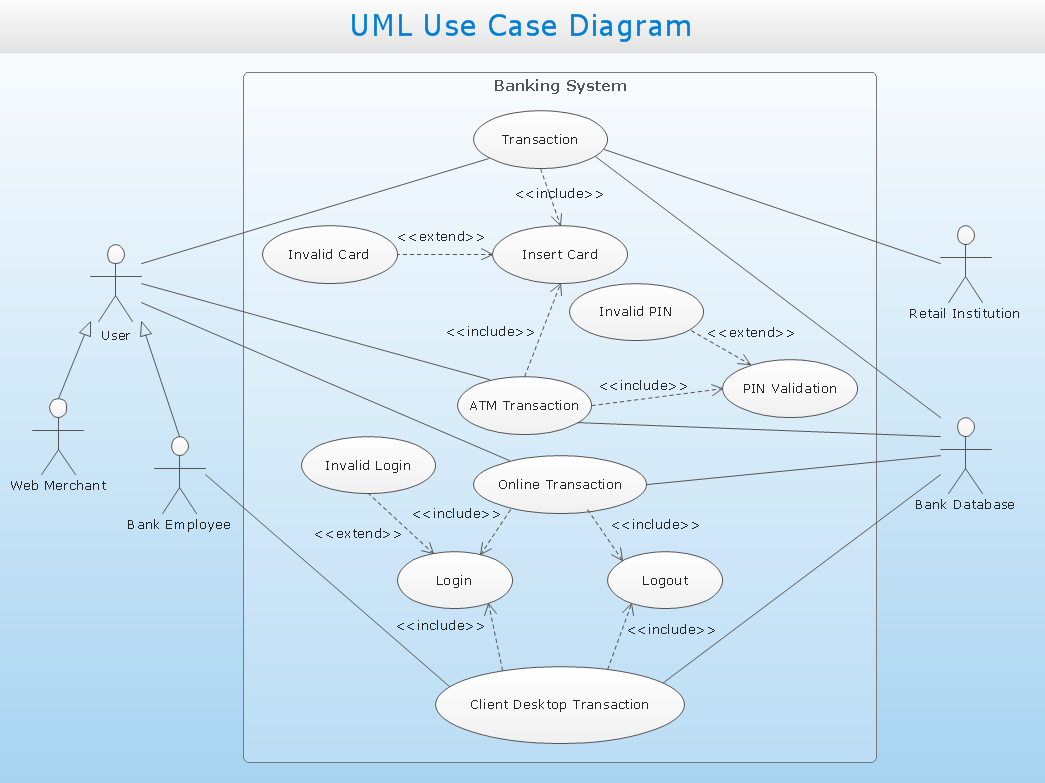
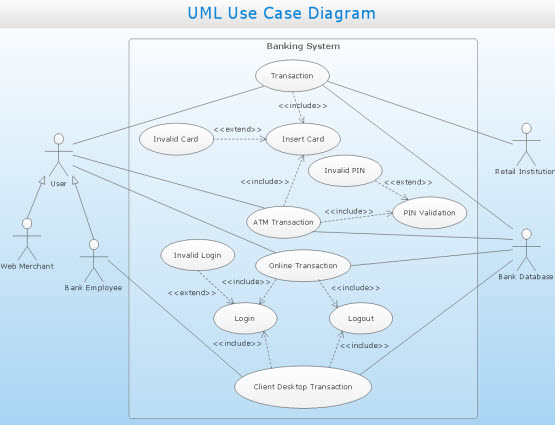
- Use Case Diagrams reflect the set of options for multiple users on a given system. This diagram is a graphical alternative to a list of requirements. It is intended to describe the interaction between the system and users.
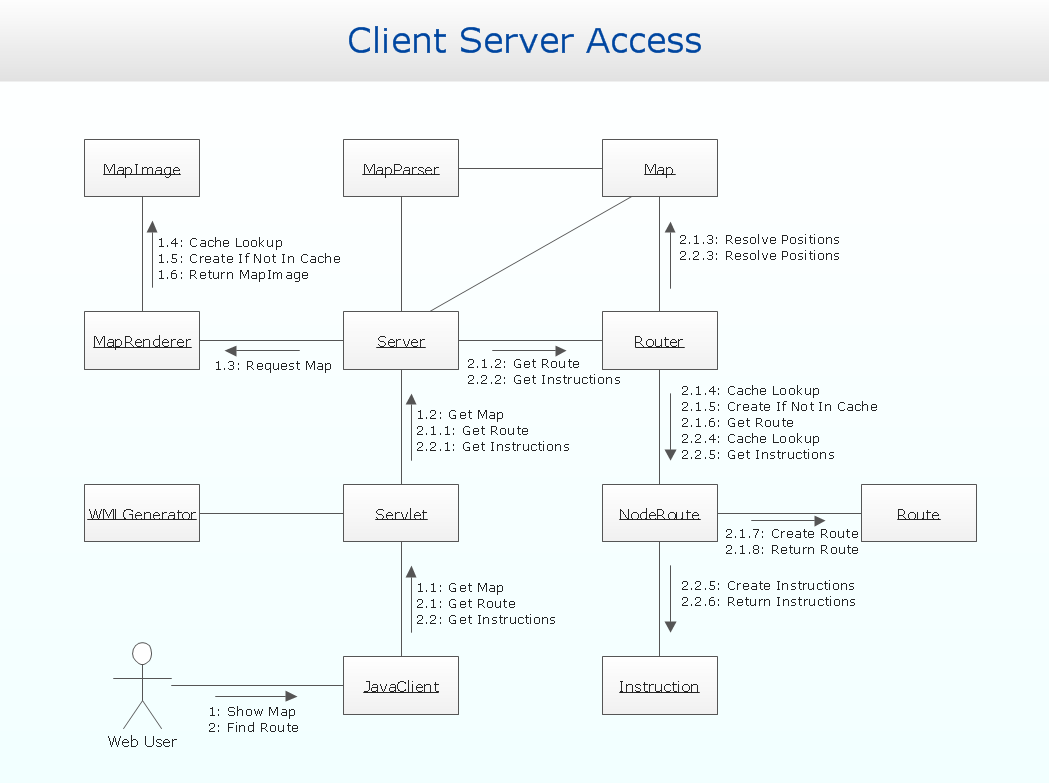
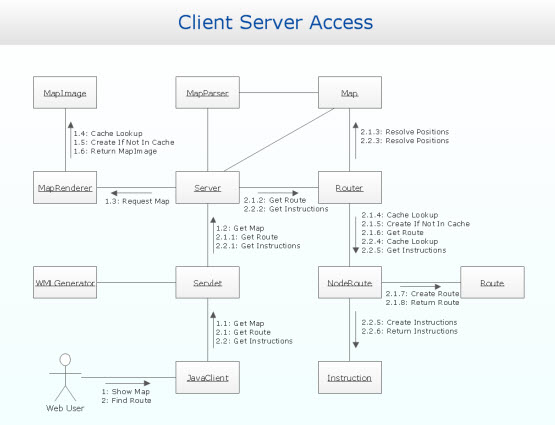
- A Communication Diagram shows the interaction between parts of a composite structure and their methods of interaction. It clearly indicates the relationship between elements (objects), as well as separating dimensions that are not used (used call numbers).
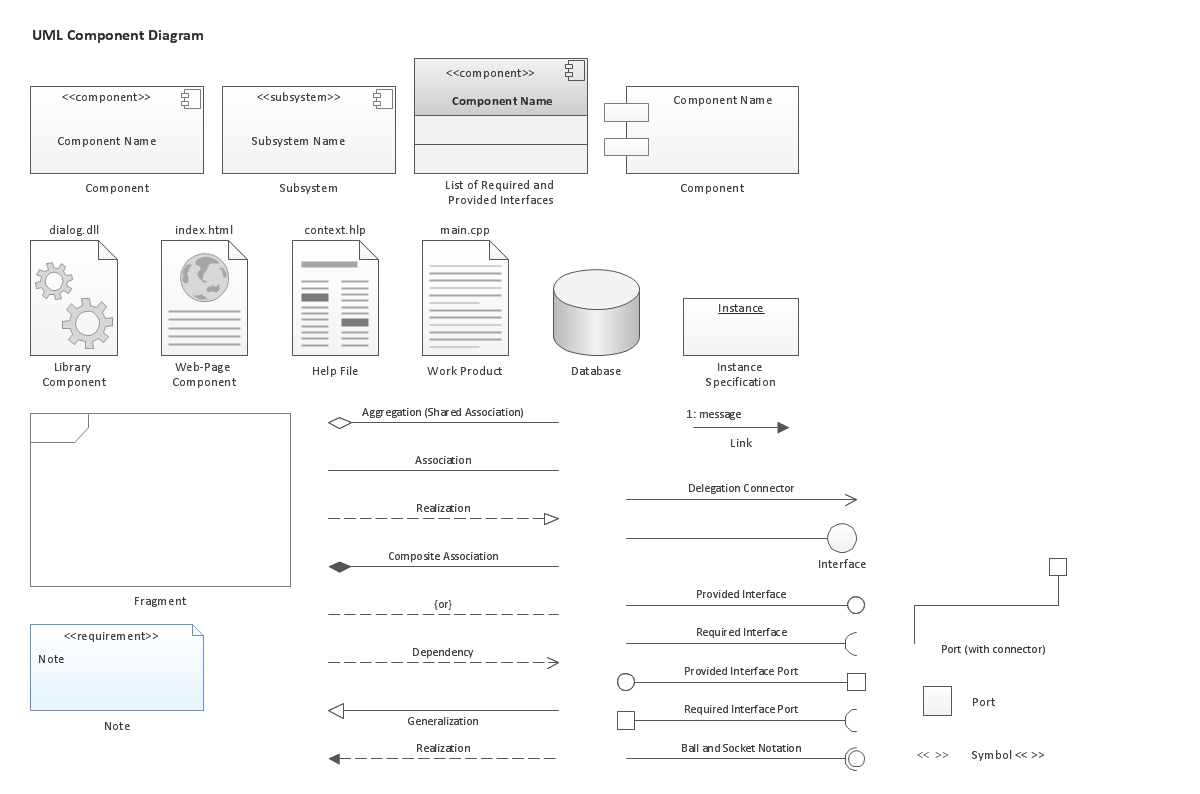
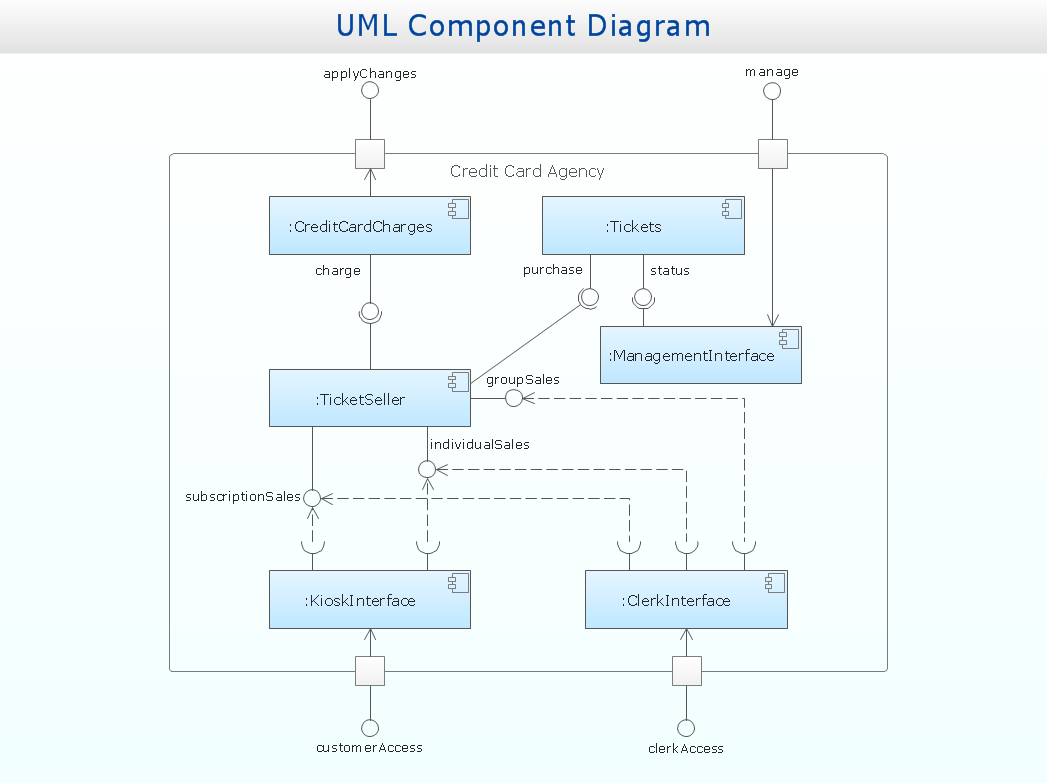
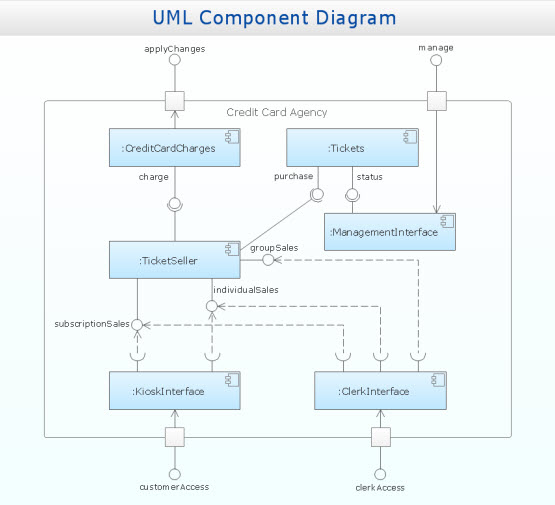
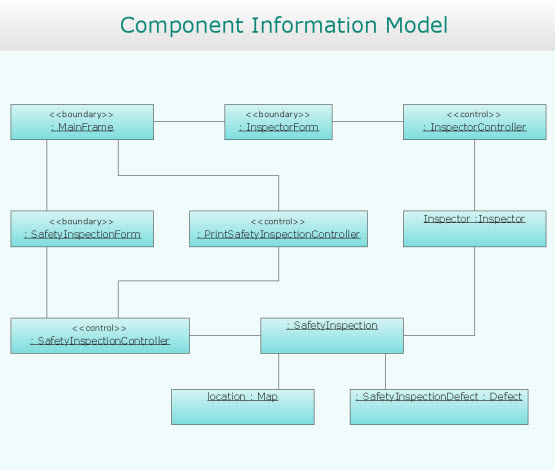
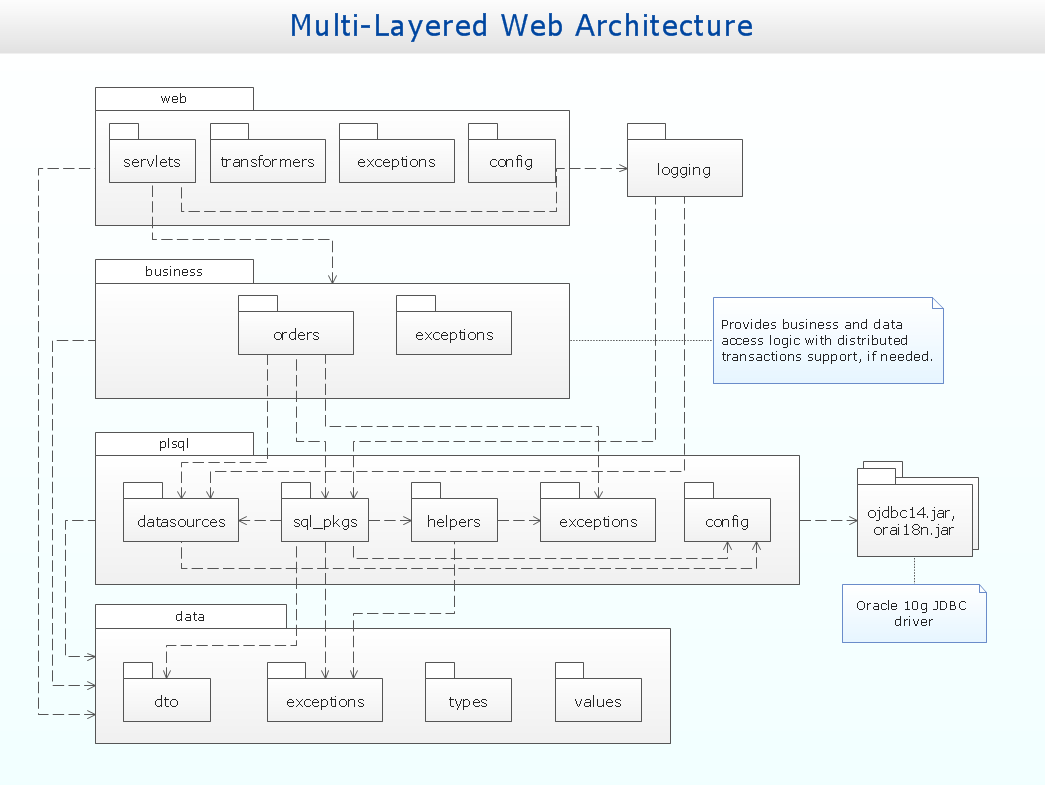
- Component Diagrams are static structural diagrams that show the breakdown of a software system into structural components, and the relationships (dependencies) between those components. The physical components can serve files, libraries, modules, executable files, packages etc.
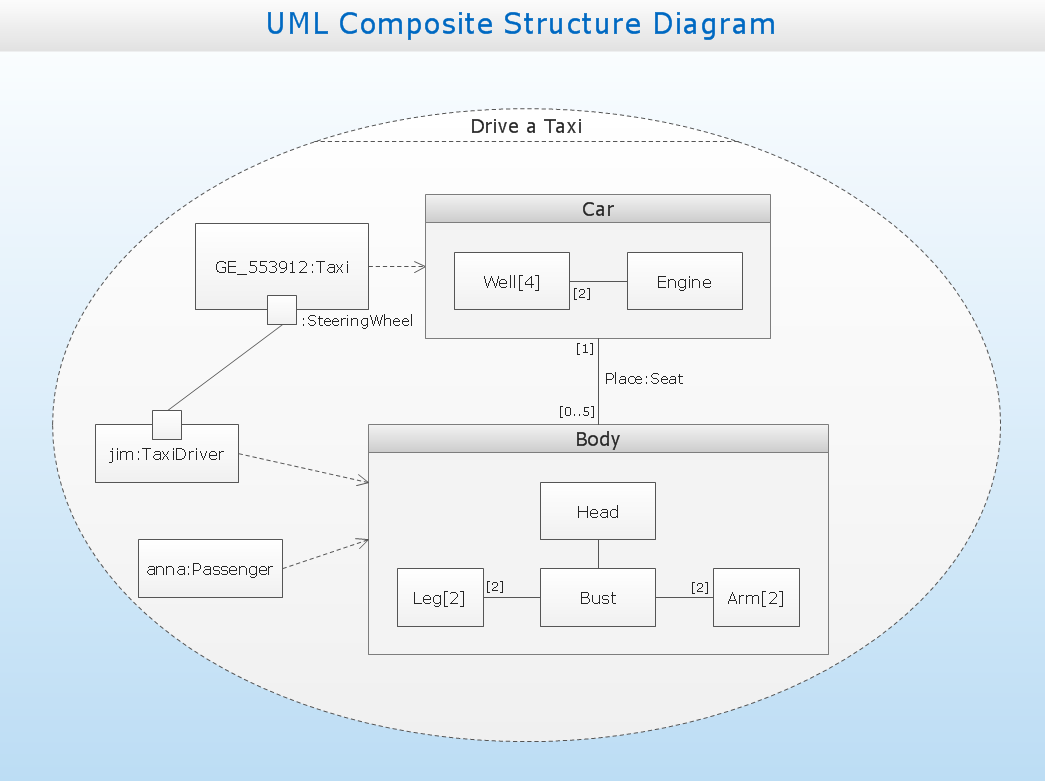
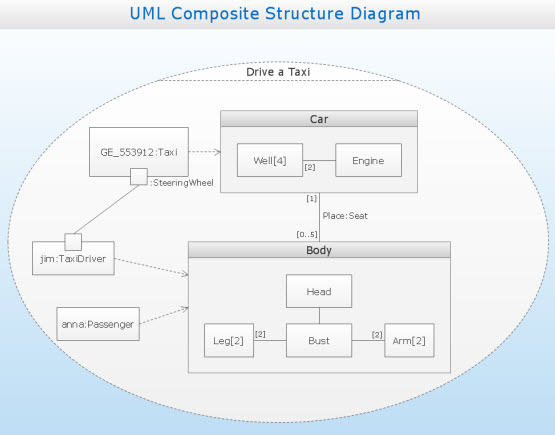
- A Composite Structure Diagram is a static structural diagram showing the internal structure of classes and, if possible, the interaction of the elements (parts) that make up the internal structure.
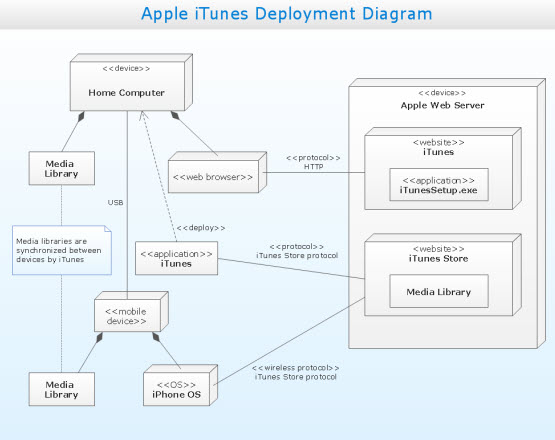
- Deployment Diagrams model the physical deployment of artifacts at nodes.Nodes are represented as cuboids, with the artifacts arranged inside them depicted as rectangles. Nodes can have sub-nodes that are presented as nested cuboids. One node on a deployment diagram can conceptually represent multiple physical nodes, such as a cluster of database servers.
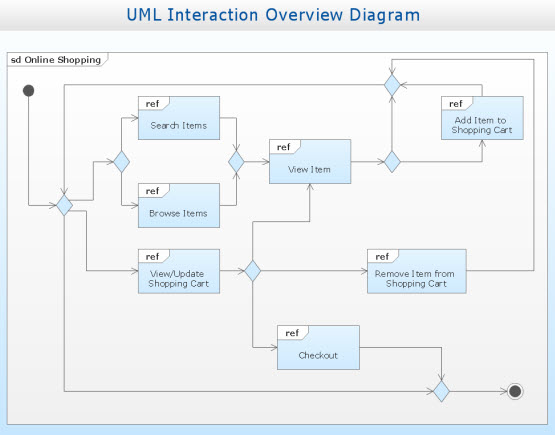
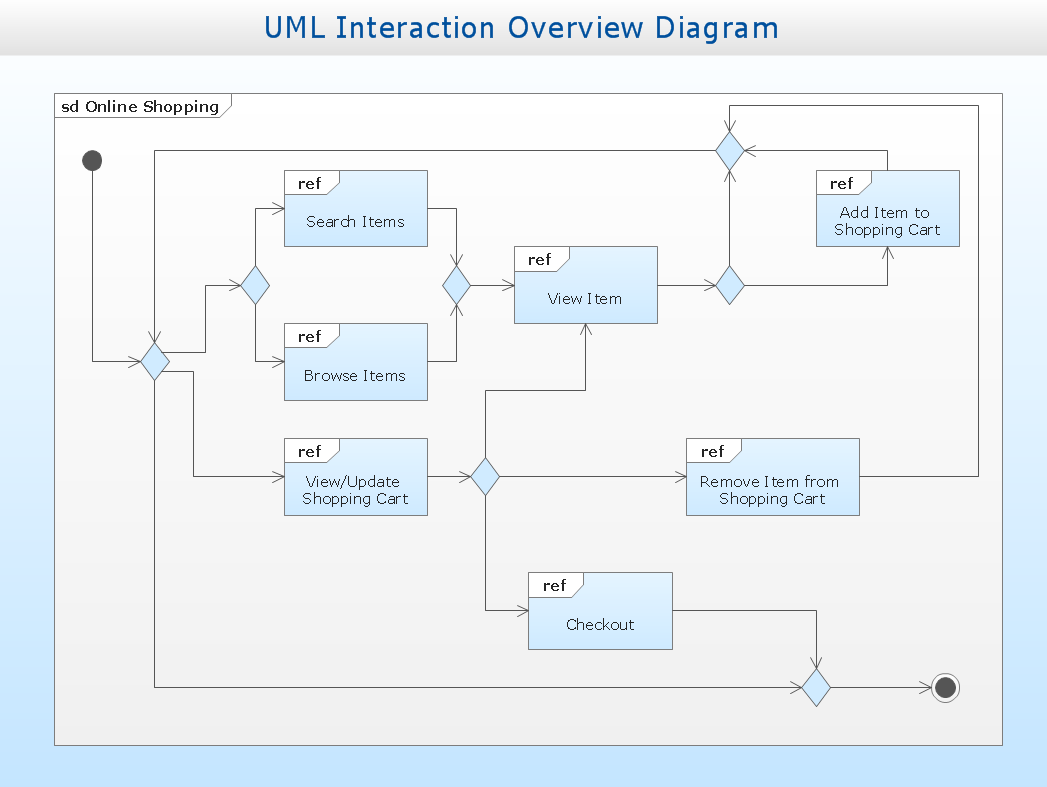
- An Interaction Overview Diagram describes a control flow with nodes that can contain interaction diagrams. The Interaction Overview diagram is similar to the Activity Diagram in that both visualize a sequence of activities.
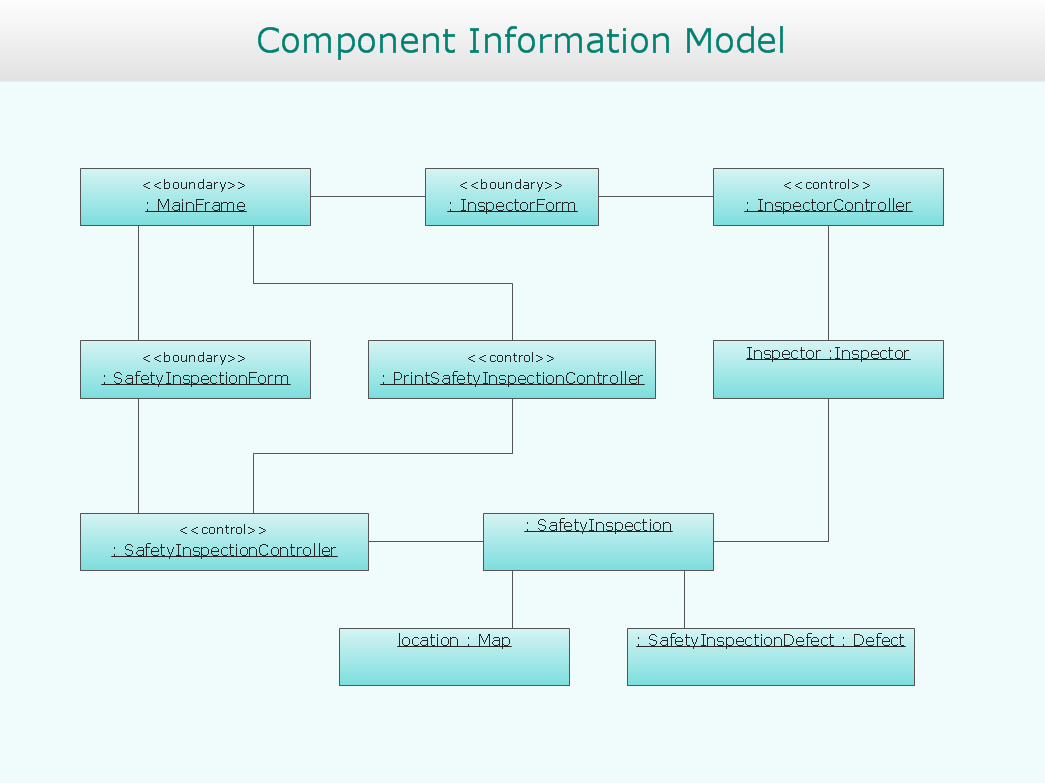
- Object Diagrams show a complete or partial snapshot of the modeled system at a given time. The diagram shows the instances of classes (objects) in the system, showing the current values of their attributes and relationships between objects.
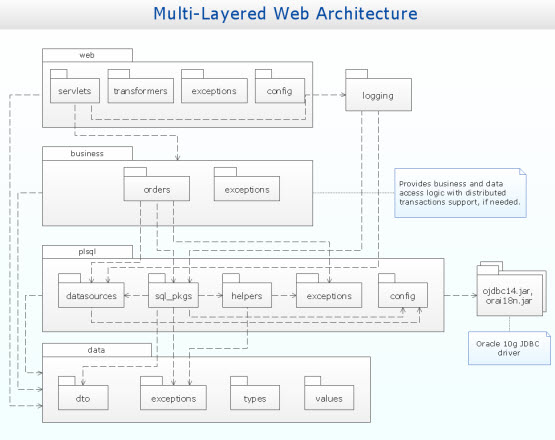
- A Package Diagram shows the dependencies between packages that forma model. Package Diagrams can use packages containing use-cases to illustrate the functionality of the software system.
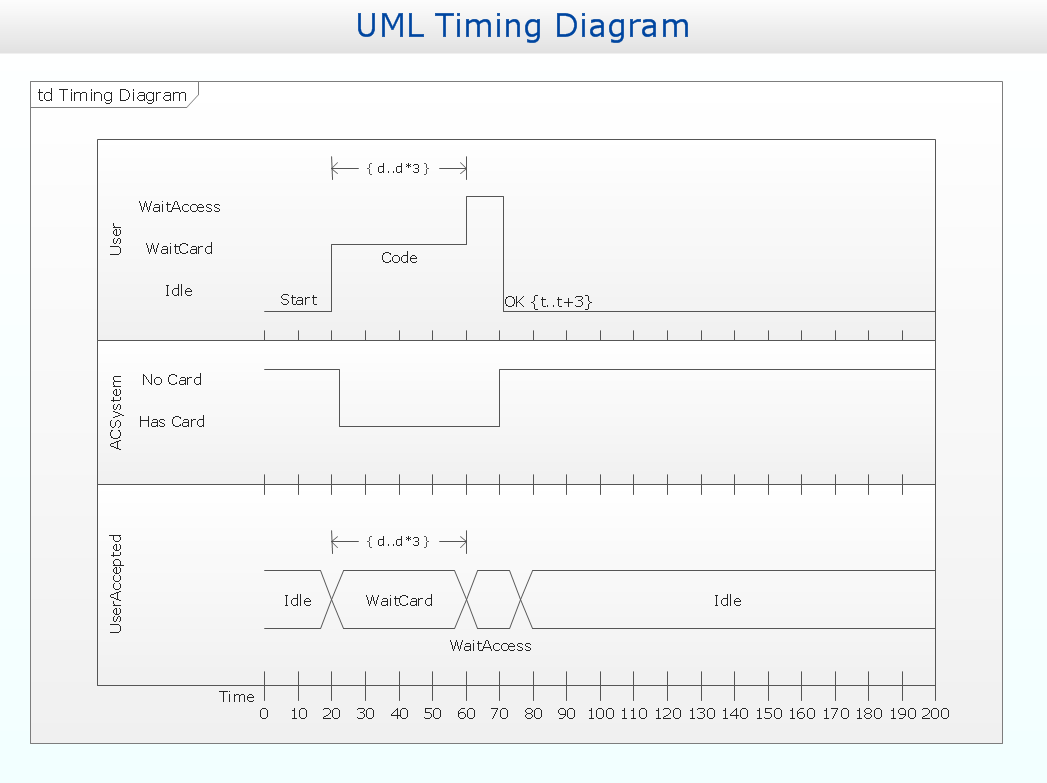
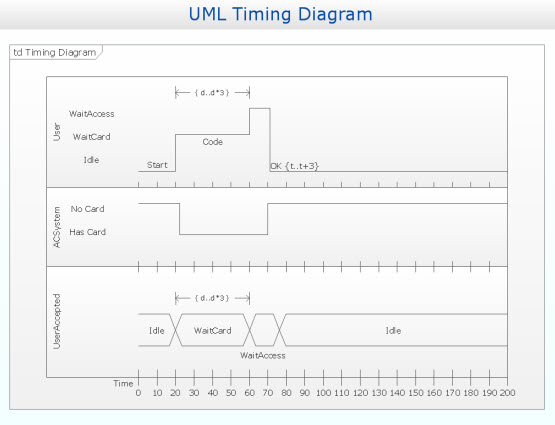
- Timing Diagrams are an alternative representation of the Sequence Diagram, explicitly showing the changes in the state of the lifeline within a specified timescale. It is most useful in real-time applications.
The 13 diagrams contained in the Rapid UML Solution offer an essential framework for systems analysts and software architects to create the diagrams they need to model processes from the conceptual level on through to project completion. Thanks to the tools in this Solution, UML diagramming has never been faster or easier. Try it today!