This site uses cookies. By continuing to browse the ConceptDraw site you are agreeing to our Use of Site Cookies.

Line Chart Template for Word

This sample was created in ConceptDraw DIAGRAM diagramming and vector drawing software using the Line Graphs Solution from Graphs and Charts area of ConceptDraw Solution Park.
This sample shows the Line Chart of annual percentage change. The Line Chart allows you to clearly see the changes of data over the time.
HelpDesk

How to Add Data-driven Infographics to MS Word Document

Infographics are usually used as an effective way of showing a certain portion of information. There are a wide of range of subjects that can be represented in such a way. One of the most simple usages for the infographics, in business diagrams. Sales staff can use it as an effective method of sharing the sales results with the entire team and stakeholders. ConceptDraw Data-driven Infographics solution gives all the tools one need to present a certain type of data. ConceptDraw DIAGRAM allows you to easily create data-driven infographics and then insert them into an MS Word document.
HelpDesk

How to Convert a Mind Map into MS Word Document

Mind maps are often used for structuring ideas, planning, and organizing of various documents. ConceptDraw MINDMAP allows you to transfer a mind map to MS Word format using its export facilities. You can convert a mind map to an MS Word outline using the set of standard templates, or even your custom template. Thus, your mind map will be transformed into the proper document format. Using a custom MS Word template allows you to apply your individual style to each document, being exported from ConceptDraw MINDMAP. You can use a mind mapping to capture ideas and structure information. Then make a quick conversion to MS Word and you finally obtain a clean and stylish document.

How to Make SWOT Analysis in a Word Document

A SWOT Analysis is a popular strategic planning tool used to evaluate the Strengths, Weaknesses, Opportunities, and Threats involved in any businesses. You can export your SWOT mind map into a MS Word document, which makes using SWOT mind map easier if you need to collaborate it with other people.
ConceptDraw products across any platform, meaning you never have to worry about compatibility again. ConceptDraw MINDMAP allows you to make SWOT analysis on PC or macOS operating systems.
HelpDesk

How to Insert a Mind Map into Microsoft Word Document

ConceptDraw MINDMAP offers several options of converting your mind map to MS Word document.
You can choose the proper format that meets your needs to communicate the content of your mind maps. Generate text, presentations, images or web pages that are pertinent to your work. Primary, you can export a mind map to MS Word. This method allows stylizing the document by using a custom MS Word templates. If you need to combine text and hierarchically structured information in a single document, the best solution is to incorporate a mind map into the MS Word document using the copy-paste capabilities of ConceptDraw MINDMAP.
HelpDesk

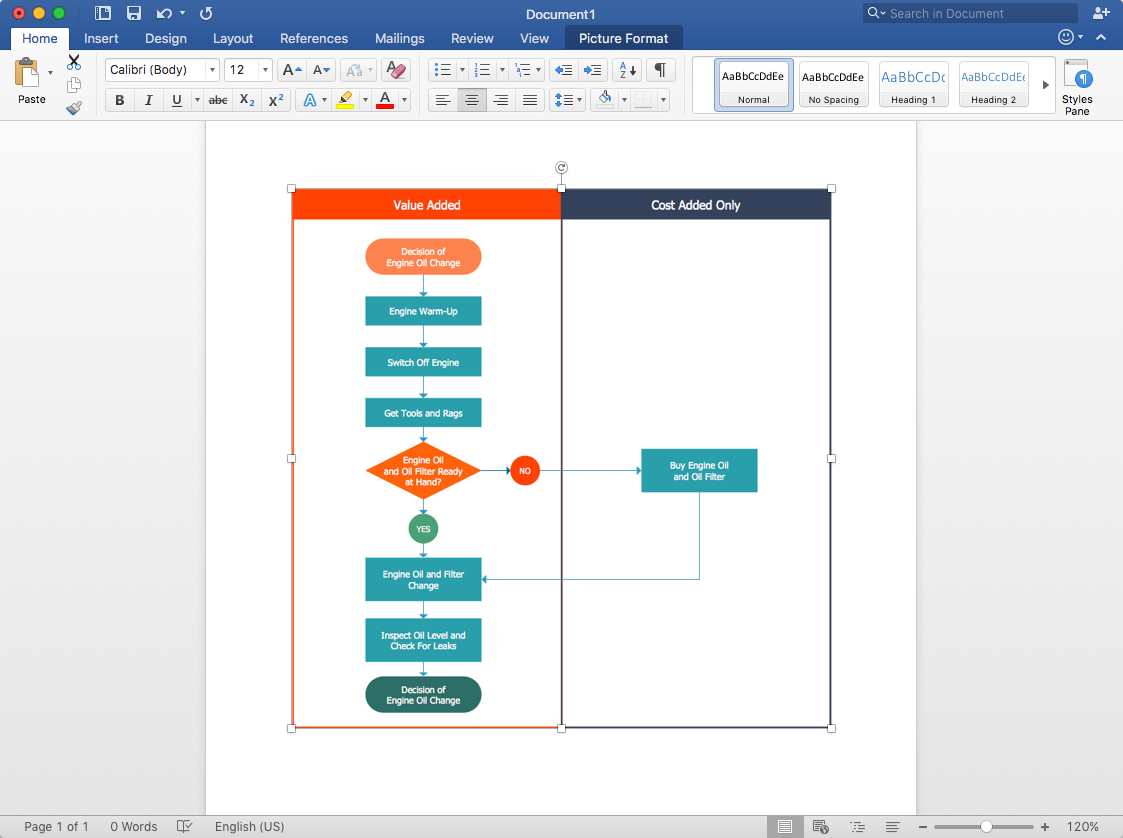
How to Add a Cross-Functional Flowchart to MS Word

A cross-functional flowchart is a type of flowchart that can be helpful in understanding a complicated process flow. ConceptDraw DIAGRAM allows you to easily create cross-functional flowcharts and then insert them into MS Word document.
HelpDesk

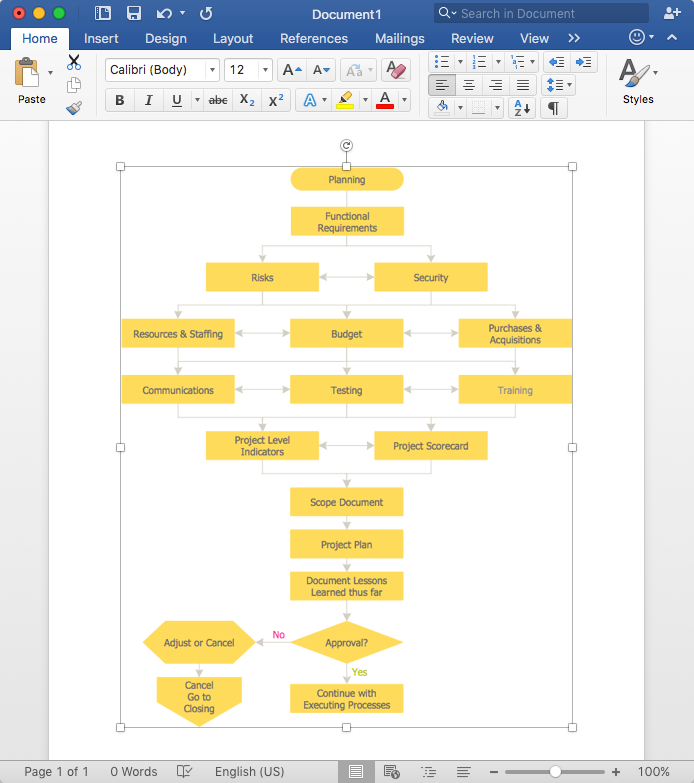
How to Add a Flowchart to MS Word Document

ConceptDraw DIAGRAM allows you to easily create flowcharts and then insert them into a MS Word document.
HelpDesk

How to Add a Bubble Diagram to MS Word

A bubble diagram is used the same purpose as a scatter diagram, but in the case, if the data has three dimensions, each of that containing the set of values. A bubble chart is a diagram in which the data points are replaced with bubbles, and the size of the bubbles represents some additional dimension of the data. A bubble chart does not have the axis. The sizes of the bubbles are determined by the values in the third dimension. Any additional information about the entities beyond their three primary dimensions can be depicted by rendering bubbles in colors and patterns that are selected in a certain way. The legend containing the further information can be added to a bubble diagram. ConceptDraw DIAGRAM allows you to easily create various business management and marketing charts, including bubble diagrams and then add them to an MS Word document.
HelpDesk

How to Use the MS Word Exchange Solution

ConceptDraw MINDMAP gives you the ability to export your mind map into a ready-to-use Microsoft Word document. You can even stylish the resulting document using the MS Word templates.

Venn Diagram Template for Word

This template shows the Venn Diagram. It was created in ConceptDraw DIAGRAM diagramming and vector drawing software using the ready-to-use objects from the Venn Diagrams Solution from the "Diagrams" area of ConceptDraw Solution Park.

mind map, mindmapping tools, mindmap, create book, create MS Word document, solution park Word Exchange

mind map, mindmapping tools, mindmap, create book, create MS Word document, solution park
This solution extends ConceptDraw MINDMAP software with the ability to quickly create the framework for a future article or book, fill the structure with ideas, and use it to produce an MS Word document with just a simple click of the mouse.
HelpDesk

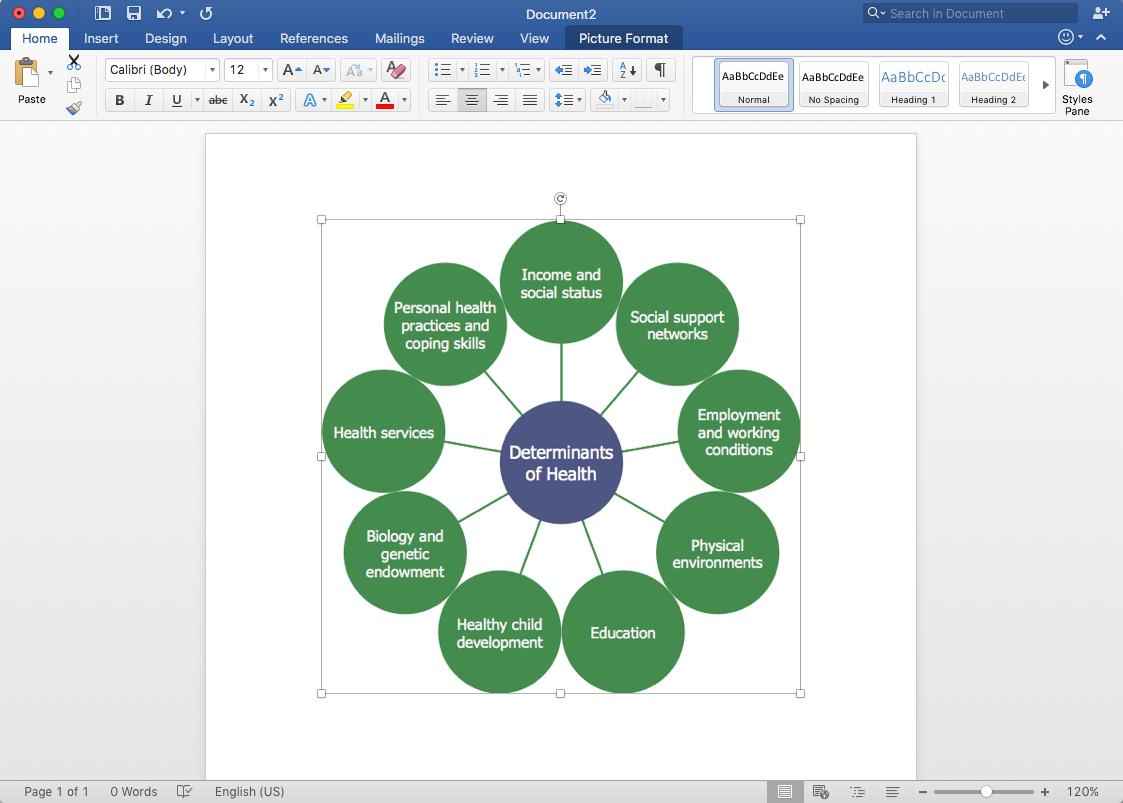
How to Add a Concept Map to MS Word Document

ConceptDraw DIAGRAM allows you to easily create concept maps and then insert them into an MS Word document.
HelpDesk

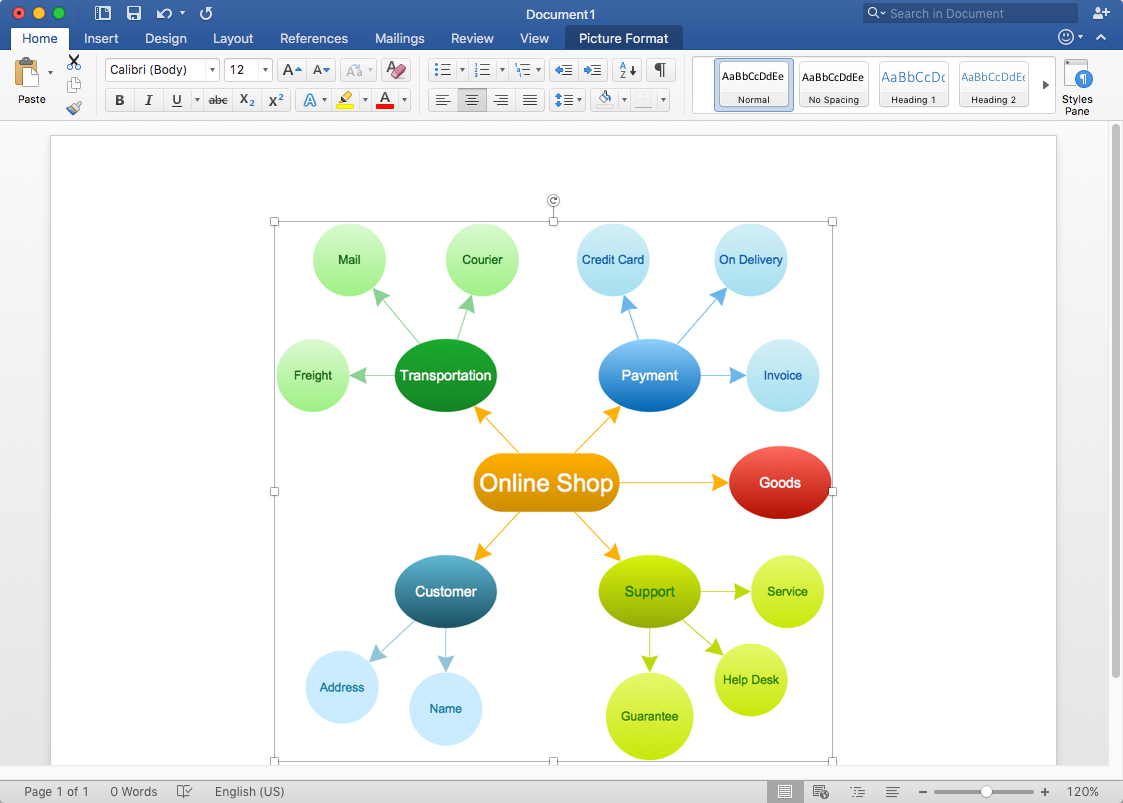
How to Add a Circle-Spoke Diagram to MS Word Document

ConceptDraw DIAGRAM allows you to easily create various marketing charts, including the circle-spoke diagrams and then insert them into an MS Word document.
HelpDesk

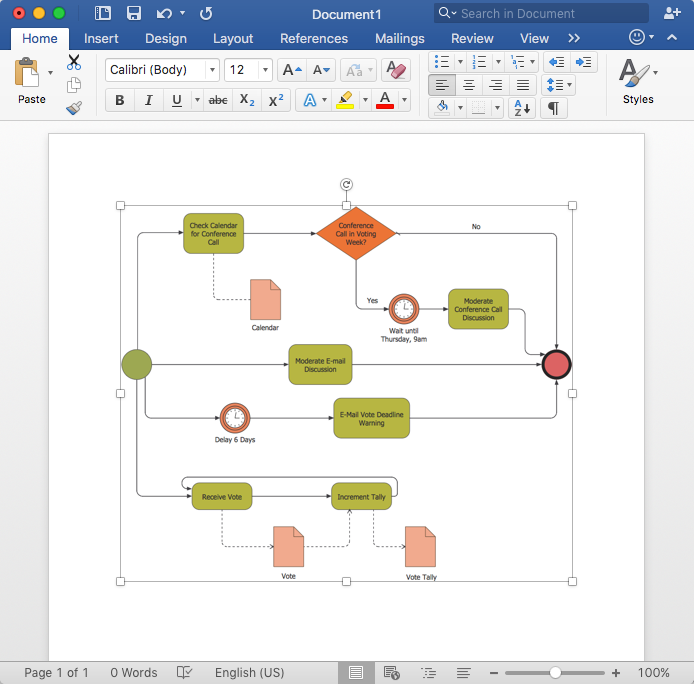
How to Add a Business Process Diagram to MS Word Document

ConceptDraw DIAGRAM allows you to easily create business process diagrams and then add them to an MS Word document.

Pie Chart Word Template. Pie Chart Examples

The Pie Chart visualizes the data as the proportional parts of a whole and looks like a disk divided into sectors. The pie chart is type of graph, pie chart looks as circle devided into sectors. Pie Charts are widely used in the business, statistics, analytics, mass media. It’s very effective way of displaying relative sizes of parts, the proportion of the whole thing.