The vector stencils library "Winter sports pictograms" contains 20 symbols of Winter Olympic sports: Alpine skiing, Alpine skiing paralympic, Biathlon, Biathlon paralympic, Bobsleigh, Cross-country, Cross-country skiing paralympic, Curling, Wheelchair curling, Figure skating, Freestyle skiing, Ice hockey, Ice sledge hockey, Luge, Nordic combined, Short track, Skeleton, Ski jumping, Snowboard, Speed skating.
The design elements library "Winter sports pictograms" for the ConceptDraw PRO diagramming and vector drawing software is included in the Winter Sports solution from the Sport area of ConceptDraw Solution Park.
The design elements library "Winter sports pictograms" for the ConceptDraw PRO diagramming and vector drawing software is included in the Winter Sports solution from the Sport area of ConceptDraw Solution Park.
Winter sports
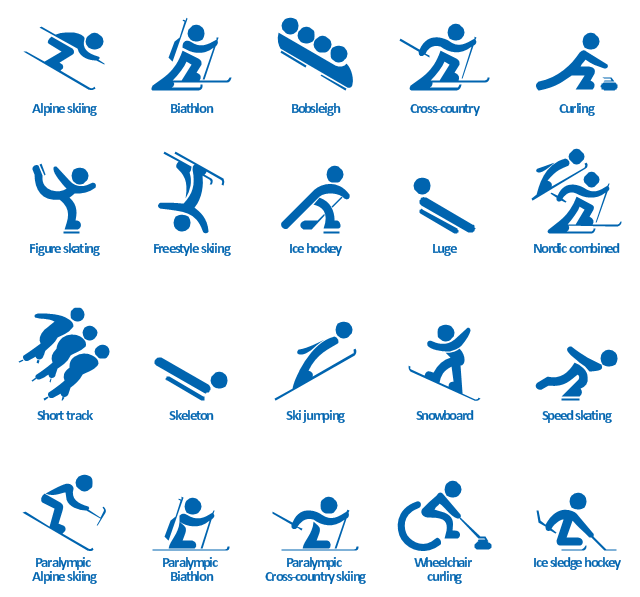
The vector stencils library "Winter sports pictograms" contains 20 pictograms of winter sports.
Use it to draw sport illustrations and infographics in the ConceptDraw PRO diagramming and vector drawing software extended with the Winter Sports solution from the Sport area of ConceptDraw Solution Park.
Use it to draw sport illustrations and infographics in the ConceptDraw PRO diagramming and vector drawing software extended with the Winter Sports solution from the Sport area of ConceptDraw Solution Park.
Alpine skiing
Alpine skiing, paralympic
Biathlon
Biathlon, paralympic

Bobsleigh

Cross-country

Cross-country skiing, paralympic

Curling

Wheelchair curling

Figure skating

Freestyle skiing
Ice hockey
Ice sledge hockey

Luge

Nordic combined
Short track
Skeleton

Ski jumping

Snowboard
Speed skating

"A 'Luge' ... is a small one- or two-person sled on which one sleds supine (face up) and feet-first. Steering is done by flexing the sled's runners with the calf of each leg or exerting opposite shoulder pressure to the seat. ... Luge is also the name of an Olympic sport. Of the three Olympic sliding sports, which include bobsleigh and skeleton, luge is the fastest and most dangerous. Lugers can reach speeds of 140 km per hour (87 mph). ...
Street luge is a recent innovation of the sport. It is considered an extreme sport, as well as an Olympic sport.
Lugers compete against a timer and are timed to a thousandth of a second, making luge one of the most precisely timed sports in the world." [Luge. Wikipedia]
The vector icon example "Luge" represents one of 20 symbols from the Winter sports pictograms library for the ConceptDraw PRO diagramming and vector drawing software.
The design elements library Winter sports pictograms is included in the Winter Sports solution from the Sport area of ConceptDraw Solution Park.
Luge

Winter Sports. Using Winter Sports Design Elements Producing Infographics

 Winter Sports
The Winter Sports solution from Sport area of ConceptDraw Solution Park contains winter sports illustration examples, templates and vector clipart libraries.
 Fishbone Diagrams
The Fishbone Diagrams solution extends ConceptDraw PRO v10 software with the ability to easily draw the Fishbone Diagrams (Ishikawa Diagrams) to clearly see the cause and effect analysis and also problem solving. The vector graphic diagrams produced using this solution can be used in whitepapers, presentations, datasheets, posters, and published technical material.
 Website Wireframe
The innovative Website Wireframe solution enhances the ConceptDraw PRO v10 functionality with newest wireframe tools, libraries with variety of predesigned icons, symbols, buttons, graphics, forms, boxes, and many other vector elements, templates and professionally designed samples, which make it the best wireframing software. Website Wireframe solution gives you significant advantages when designing and maintaining websites, creating skeletal and content-free depictions of website structure, making website prototypes and planning the content arrangement before committing to design, also speeds up the processes of sketching, producing and sharing wireframe examples of website style and interface design.
 Education Package
Education Package is a comprehensive set of multifarious graphical solutions from ConceptDraw Solution Park, collected together in help to ConceptDraw PRO users working in a field of science, education and training, which is aimed at improving the quality of education and helping to design with ease variety of interesting and colorful educational materials, diagrams, charts and maps. Use it to present the information and knowledge in an interesting, clear, structured and simple form to achieve a success in education and pedagogy, to maintain the interest of students and pupils throughout the whole learning process, at the lectures, lessons and even during independent work with additional materials, to contribute to better perception of scientific information by listeners during the conferences and reports.
- Winter Sport Pictogram Skeleton
- Bobsleigh - Winter sports pictograms | Skeleton Bob Symbol
- Skeleton - Winter sports pictograms | Freestyle skiing - Winter sports ...
- Sport pictograms . Olympic Games | Winter Olympics - Skeleton ...
- Bobsleigh - Winter sports pictograms | Winter Sports | Skeleton ...
- Winter Olympics - Skeleton | Winter Sports | Sport pictograms ...
- Skeleton - Winter sports pictograms | Winter Olympics - Skeleton ...
- Skeleton - Winter sports pictograms | Biathlon, paralympic - Winter ...
- Luge - Winter sports pictograms | Design elements - Winter sports ...
- Skeleton - Winter sports pictograms | Ice sledge hockey - Winter ...
- Winter Sports | Fishbone Diagrams | Specific Rules Of The Sport ...
- Winter sports pictograms - Vector stencils library | Sport pictograms ...
- Luge - Winter sports pictograms | Winter Sports | Skeleton - Winter ...
- Design elements - Winter sports pictograms | Luge - Winter sports ...
- Design elements - Winter sports pictograms | Design elements ...
- Biathlon, paralympic - Winter sports pictograms | Winter sports ...
- Winter sports pictograms - Vector stencils library | Winter Sports ...
- Winter Sport Pictogram Luge
- Design elements - Winter sports pictograms | Winter sports ...
- Winter sports pictograms - Vector stencils library | Design elements ...
- ERD | Entity Relationship Diagrams, ERD Software for Mac and Win
- Flowchart | Basic Flowchart Symbols and Meaning
- Flowchart | Flowchart Design - Symbols, Shapes, Stencils and Icons
- Flowchart | Flow Chart Symbols
- Electrical | Electrical Drawing - Wiring and Circuits Schematics
- Flowchart | Common Flowchart Symbols
- Flowchart | Common Flowchart Symbols