This site uses cookies. By continuing to browse the ConceptDraw site you are agreeing to our Use of Site Cookies.

Biology Drawing Software

Biology is incredibly interesting and useful natural science which studies all living things on the earth (people, animals, plants), structure, functions, interactions, evolution of living organisms. Biologists of the whole world use actively illustrations and drawings in your science and education activity. To facilitate their task of biology drawing, ConceptDraw DIAGRAM diagramming and vector drawing software was extended with Biology solution from the Science and Education area. Now, ConceptDraw DIAGRAM is a powerful biology drawing software.

Electrical Drawing Software and Electrical Symbols

ConceptDraw DIAGRAM is a powerful software for creating professional looking electrical circuits quick and easy. For this purpose you can use the Electrical Engineering solution from the "Engineering" area of ConceptDraw Solution Park.
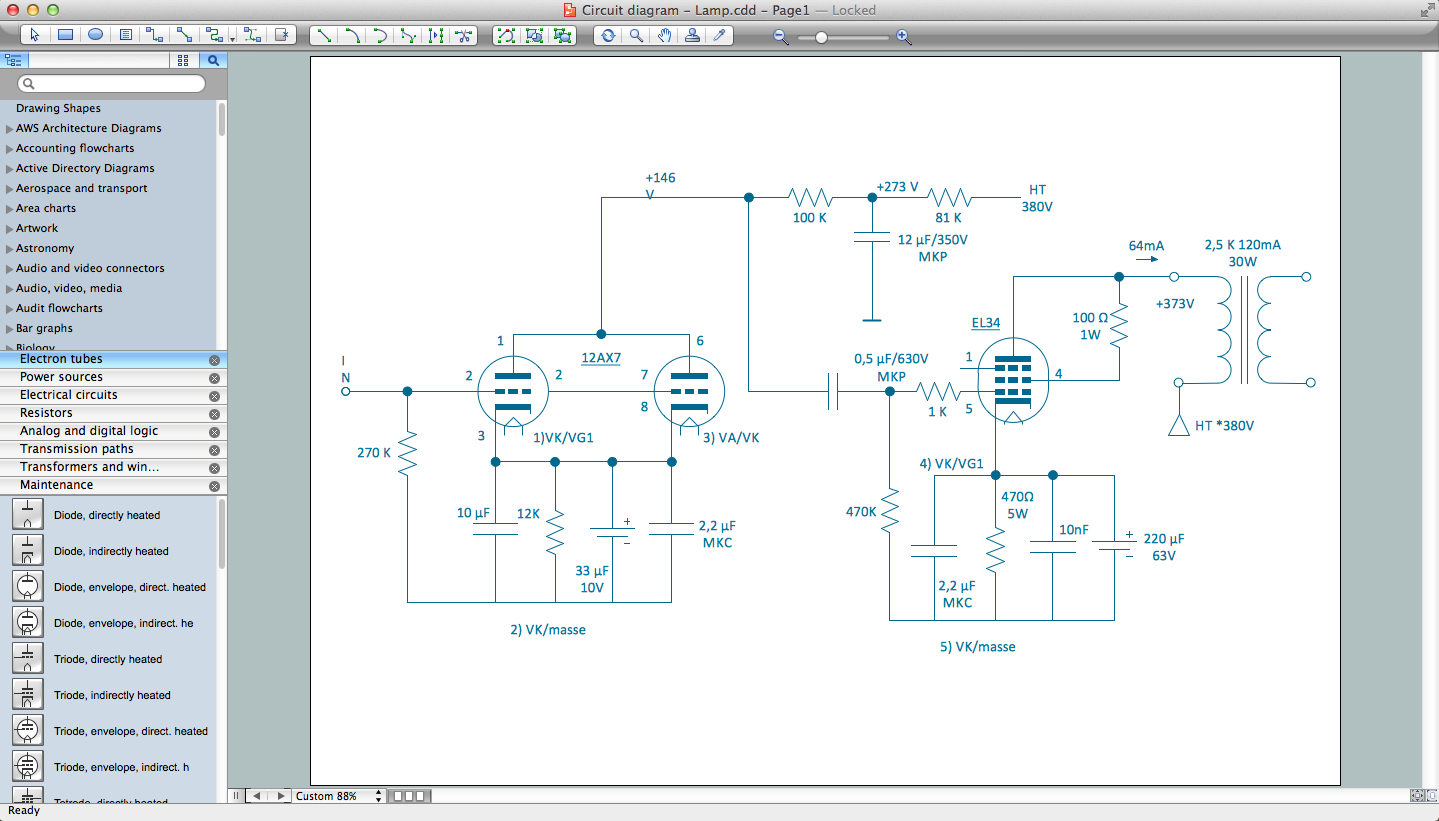
Electrical Drawing Software provides the 26 stencils libraries of ready-to-use predesigned vector electrical symbols, templates and samples that make your electrical drawing quick, easy and effective.

Bar Diagrams for Problem Solving. Create space science bar charts with Bar Graphs Solution

Bar charts represent data in different categories or groups.
Create bar graphs for visual solving your scientific problems and data comparison using the ConceptDraw DIAGRAM diagramming and vector drawing software extended with the Bar Graphs Solution from the Graphs and Charts area of ConceptDraw Solition Park.

Draw Fishbone Diagram on MAC Software

There are many tools to facilitate the problem solving process. Cause and Effect diagram, or Fishbone diagram is one of them. Fishbone diagram can be constructed following 5 simple steps.
Professional diagramming ConceptDraw DIAGRAM MAC OSX software with Fishbone Diagrams solution helps you make cause and effect analysis, identify the possible causes for an effect for problem solving, draw Fishbone diagram on Mac software aka Ishikawa diagram from brainstorm, templates and examples.

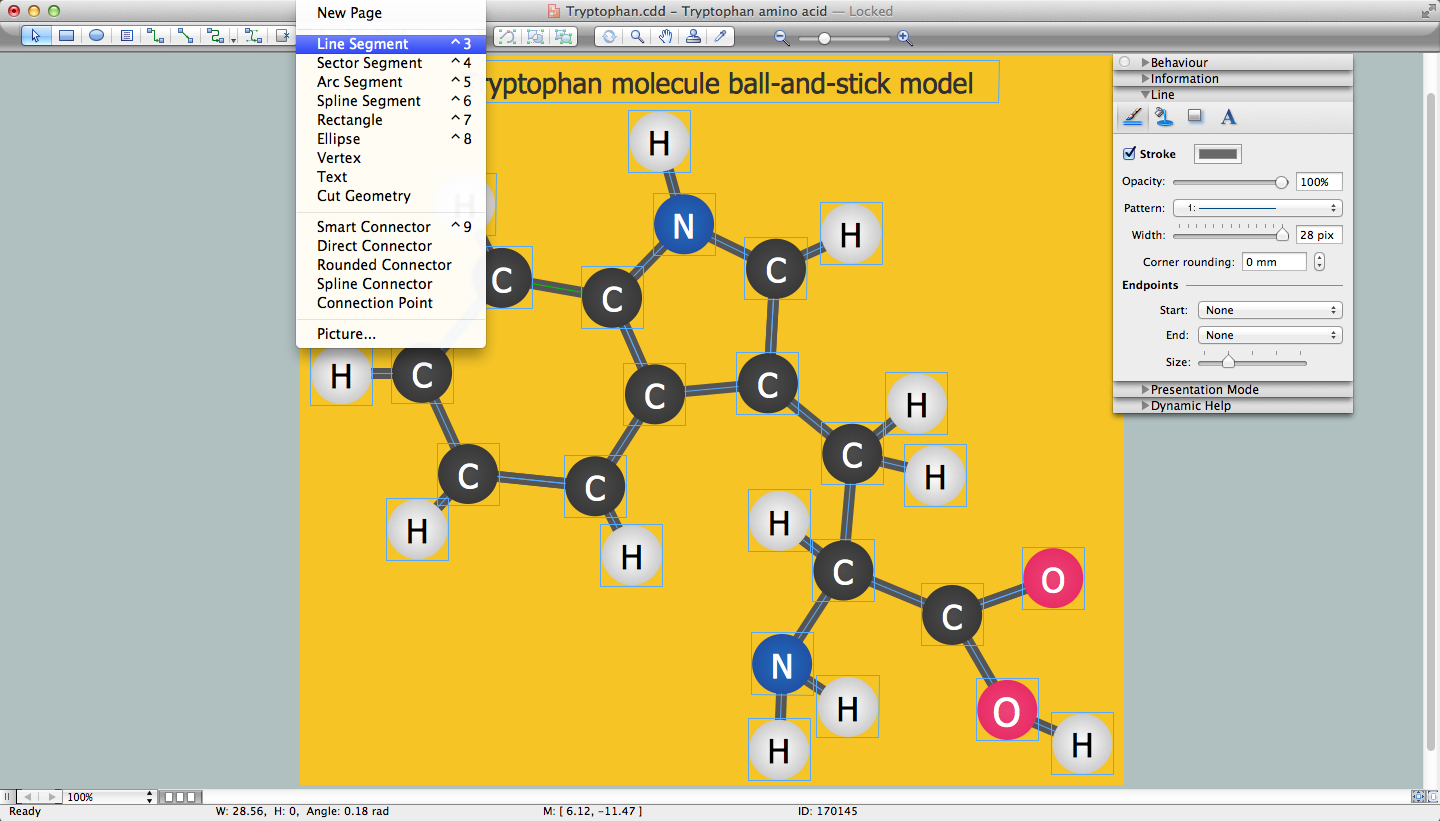
Chemistry Drawing Software
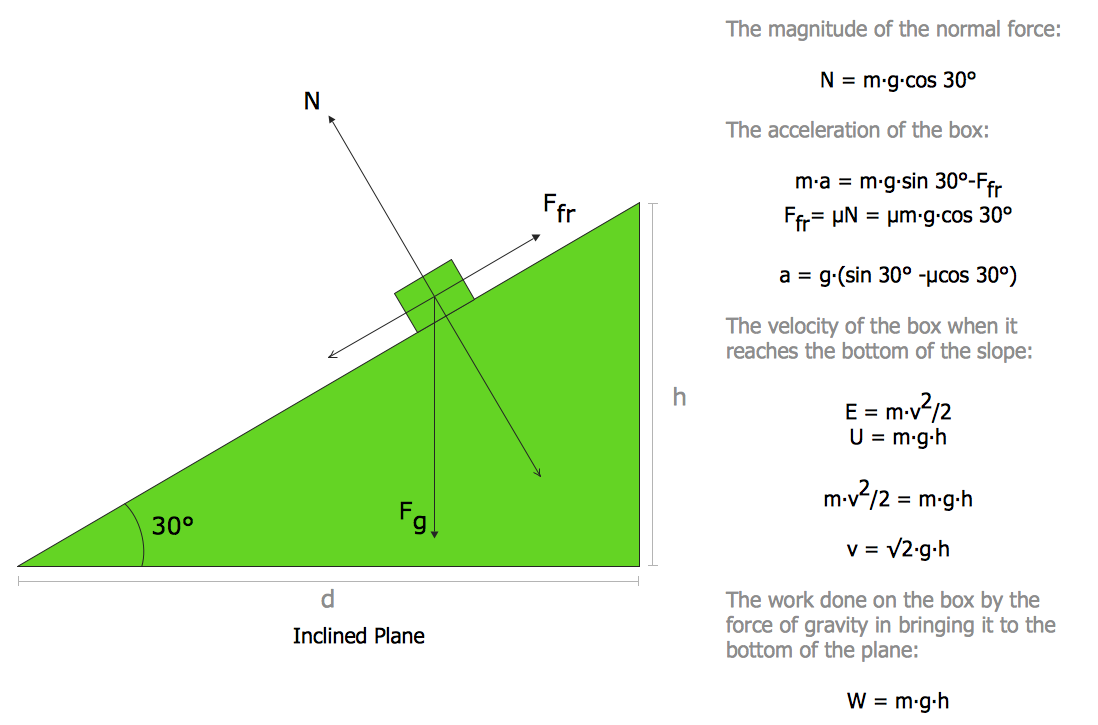
ConceptDraw DIAGRAM extended with Chemistry solution from the Science and Education area is a powerful chemistry drawing software that provides the useful tools to help you design all kinds of chemistry drawings and illustrations, chemical schemes and diagrams of formulas, reaction schemes and lab set-ups of any complexity.

Physics Diagrams

ConceptDraw DIAGRAM diagramming and vector drawing software extended with Physics solution from the Science and Education area is the best for creating: physics diagrams, pictures which describe various physical facts and experiments, illustrations of various electrical, mechanical and optic processes, of any complexity quick and easy.

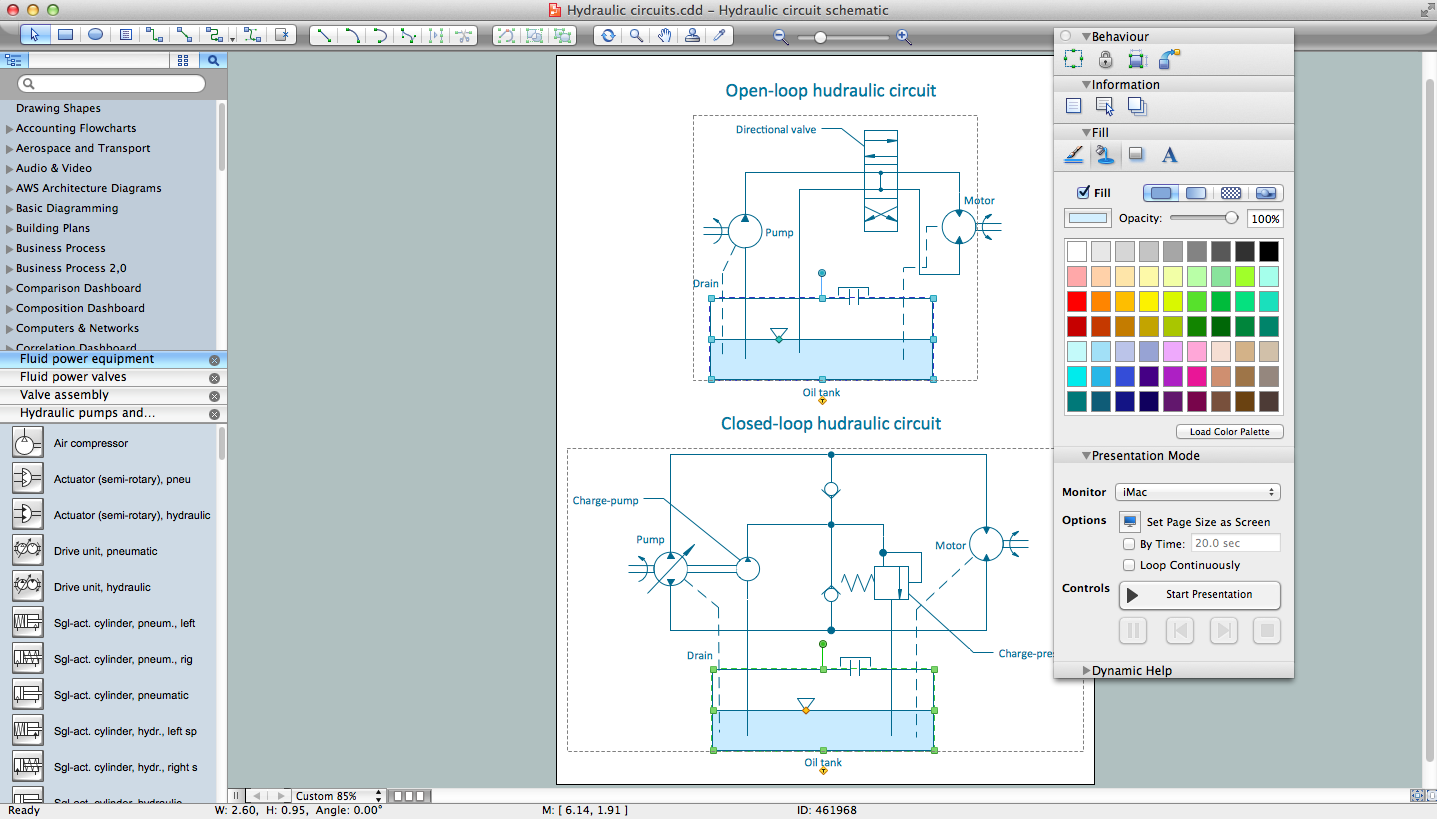
Technical Drawing Software

Science and technology rapidly develop in the modern world. Electronic devices, computers and various software are very popular now. The technical drawing software is already necessity today. ConceptDraw DIAGRAM is new software for business and technical drawing. It offers a powerful tools for all kinds of technical drawing with pre-drawn shapes, free samples of business drawings and flowcharts, support for many graphic formats enables users to visually develop their technical drawings charts, schematics and diagrams in any combination of drawings, diagrams and flow charts.

Simple Drawing Applications for Mac

ConceptDraw gives the ability to draw simple diagrams like flowcharts, block diagrams, bar charts, histograms, pie charts, divided bar diagrams, line graphs, area charts, scatter plots, circular arrows diagrams, Venn diagrams, bubble diagrams, concept maps, and others.

Venn Diagram Examples for Problem Solving. Computer Science. Chomsky Hierarchy

A Venn diagram, sometimes referred to as a set diagram, is a diagramming style used to show all the possible logical relations between a finite amount of sets. In mathematical terms, a set is a collection of distinct objects gathered together into a group, which can then itself be termed as a single object. Venn diagrams represent these objects on a page as circles or ellipses, and their placement in relation to each other describes the relationships between them.
The Venn diagram example below visualizes the the class of language inclusions described by the Chomsky hierarchy.

Mathematical Diagrams

ConceptDraw DIAGRAM diagramming and vector drawing software extended with Mathematics solution from the Science and Education area is the best for creating: mathematical diagrams, graphics, tape diagrams various mathematical illustrations of any complexity quick and easy.
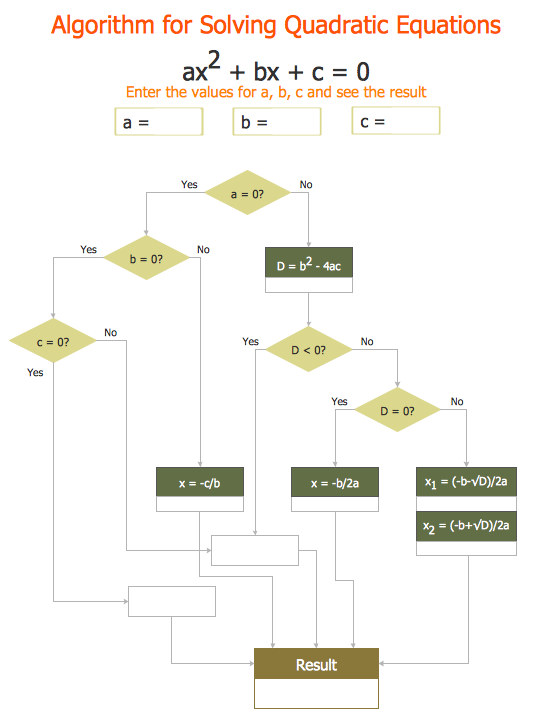
Mathematics solution provides 3 libraries: Plane Geometry Library, Solid Geometry Library, Trigonometric Functions Library.