Activity Network (PERT) Chart

Examples of Flowcharts, Org Charts and More


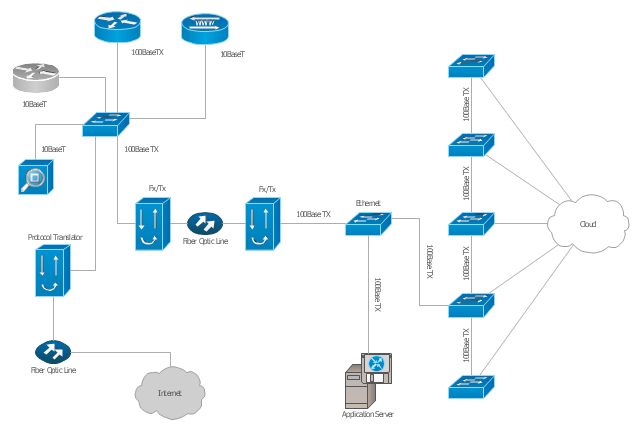
"A computer network diagram is a schematic depicting the nodes and connections amongst nodes in a computer network or, more generally, any telecommunications network. ...
Depending on whether the diagram is intended for formal or informal use, certain details may be lacking and must be determined from context. ...
At different scales diagrams may represent various levels of network granularity. At the LAN level, individual nodes may represent individual physical devices, such as hubs or file servers, while at the WAN level, individual nodes may represent entire cities. In addition, when the scope of a diagram crosses the common LAN/ MAN/ WAN boundaries, representative hypothetical devices may be depicted instead of showing all actually existing nodes." [Computer network diagram. Wikipedia]
The Cisco computer network diagram example "Network organization chart" was created using the ConceptDraw PRO diagramming and vector drawing software extended with the Cisco Network Diagrams solution from the Computer and Networks area of ConceptDraw Solution Park.
Cisco network diagram
Activity Network Diagram Method

 Cisco Network Diagrams
Cisco Network Diagrams solution extends ConceptDraw DIAGRAM with the best characteristics of network diagramming software. Included samples, templates and libraries of built-in standardized vector Cisco network icons and Cisco symbols of computers, network devices, network appliances and other Cisco network equipment will help network engineers, network designers, network and system administrators, as well as other IT professionals and corporate IT departments to diagram efficiently the network infrastructure, to visualize computer networks topologies, to design Cisco computer networks, and to create professional-looking Cisco Computer network diagrams, Cisco network designs and schematics, Network maps, and Network topology diagrams in minutes.
HelpDesk
How To Create a PERT Chart Using PM Easy Solution

"A project network is a graph (flow chart) depicting the sequence in which a project's terminal elements are to be completed by showing terminal elements and their dependencies.
... the project network shows the "before-after" relations.
The most popular form of project network is activity on node, the other one is activity on arrow.
The condition for a valid project network is that it doesn't contain any circular references." [Project network. Wikipedia]
The PERT chart example "Project management plan" was created using the ConceptDraw PRO diagramming and vector drawing software extended with the solution "Seven Management and Planning Tools" from the Management area of ConceptDraw Solution Park.
PERT

Legend

The PERT chart shows the logical connections and consequence of a set of tasks. PERT charts the time period for problem solving and the implementation plan for all activities along the critical path. The PERT chart is also known as a precedence diagram or project network diagram.
"The Program (or Project) Evaluation and Review Technique, commonly abbreviated PERT, is a statistical tool, used in project management, that is designed to analyze and represent the tasks involved in completing a given project. ...
PERT is a method to analyze the involved tasks in completing a given project, especially the time needed to complete each task, and to identify the minimum time needed to complete the total project.
PERT was developed primarily to simplify the planning and scheduling of large and complex projects. ...
A network diagram can be created by hand or by using diagram software. There are two types of network diagrams, activity on arrow (AOA) and activity on node (AON). Activity on node diagrams are generally easier to create and interpret." [Program Evaluation and Review Technique. Wikipedia]
The PERT chart is one of the Seven Management and Planning Tools (7 MP tools, Seven New Quality Tools).
The PERT chart template for the ConceptDraw PRO diagramming and vector drawing software is included in the solution "Seven Management and Planning Tools" from the Management area of ConceptDraw Solution Park.
PERT chart template

Legend

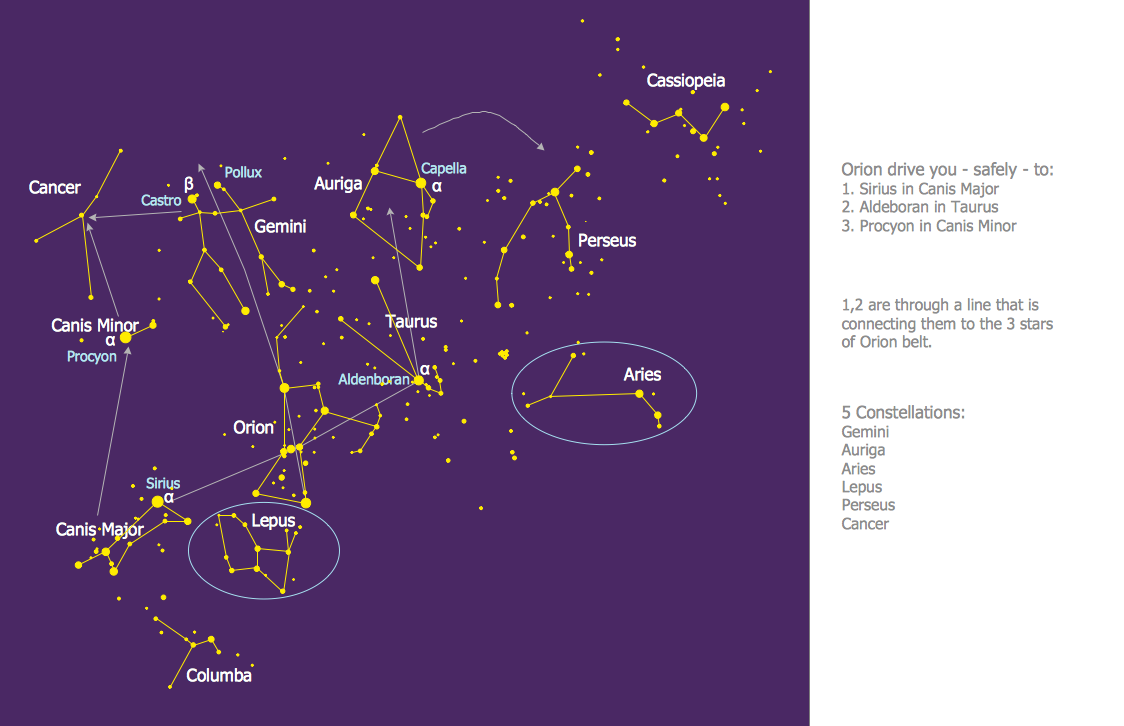
Constellation Chart
"A computer network diagram is a schematic depicting the nodes and connections amongst nodes in a computer network or, more generally, any telecommunications network. ...
Depending on whether the diagram is intended for formal or informal use, certain details may be lacking and must be determined from context. ...
At different scales diagrams may represent various levels of network granularity. At the LAN level, individual nodes may represent individual physical devices, such as hubs or file servers, while at the WAN level, individual nodes may represent entire cities. In addition, when the scope of a diagram crosses the common LAN/ MAN/ WAN boundaries, representative hypothetical devices may be depicted instead of showing all actually existing nodes." [Computer network diagram. Wikipedia]
The Cisco computer network diagram example "Network organization chart" was created using the ConceptDraw PRO diagramming and vector drawing software extended with the Cisco Network Diagrams solution from the Computer and Networks area of ConceptDraw Solution Park.
Depending on whether the diagram is intended for formal or informal use, certain details may be lacking and must be determined from context. ...
At different scales diagrams may represent various levels of network granularity. At the LAN level, individual nodes may represent individual physical devices, such as hubs or file servers, while at the WAN level, individual nodes may represent entire cities. In addition, when the scope of a diagram crosses the common LAN/ MAN/ WAN boundaries, representative hypothetical devices may be depicted instead of showing all actually existing nodes." [Computer network diagram. Wikipedia]
The Cisco computer network diagram example "Network organization chart" was created using the ConceptDraw PRO diagramming and vector drawing software extended with the Cisco Network Diagrams solution from the Computer and Networks area of ConceptDraw Solution Park.
Cisco network diagram
HelpDesk
How to Draw a Pictorial Chart

Business Diagram Software


Cisco Network Templates


HelpDesk
How to Create Organizational Chart Quickly

HelpDesk
How to Draw a Gantt Chart

Cisco Design
 Pie Charts
Pie Charts are extensively used in statistics and business for explaining data and work results, in mass media for comparison (i.e. to visualize the percentage for the parts of one total), and in many other fields. The Pie Charts solution for ConceptDraw DIAGRAM offers powerful drawing tools, varied templates, samples, and a library of vector stencils for simple construction and design of Pie Charts, Donut Chart, and Pie Graph Worksheets.
HelpDesk
How to Draw an Organizational Chart

HelpDesk
How to Draw a Pie Chart

- Telecommunication Network Diagrams | Network Diagram Software ...
- Activity Network Chart In Softwrae Project Management
- Activity Network (PERT) Chart | ConceptDraw PRO Network ...
- Activity on Node Network Diagramming Tool | PERT chart ...
- Activity Network (PERT) Chart | Process decision program chart ...
- Activity Network (PERT) Chart | Activity Network Diagram Method ...
- Network organization chart
- Cisco Network Templates | Network organization chart | Cisco ...
- Activity Network (PERT) Chart | Program Evaluation and Review ...
- Examples of Flowcharts, Org Charts and More | Network Diagram ...
- Activity Network (PERT) Chart | PM Easy | How To Create a PERT ...
- Activity Network (PERT) Chart | PERT chart - Project management ...
- PM Easy | Seven Management and Planning Tools | Activity Network ...
- How to Draw an Organization Chart | How to Draw a Computer ...
- Activity on Node Network Diagramming Tool | PERT chart template ...
- Activity Network Diagram Method | Activity on Node Network ...
- Activity Network (PERT) Chart | Organizational Charts | Program ...
- ConceptDraw PRO Network Diagram Tool | PERT chart template ...
- Organizational Charts | Network organization chart | How to Draw an ...
- Network organization chart | Cooperative vehicular delay-tolerant ...