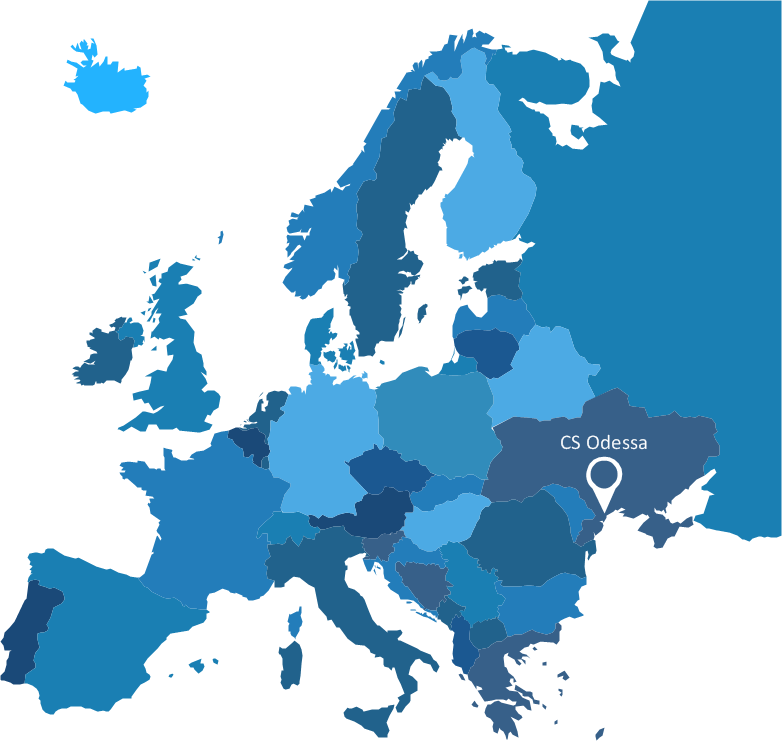
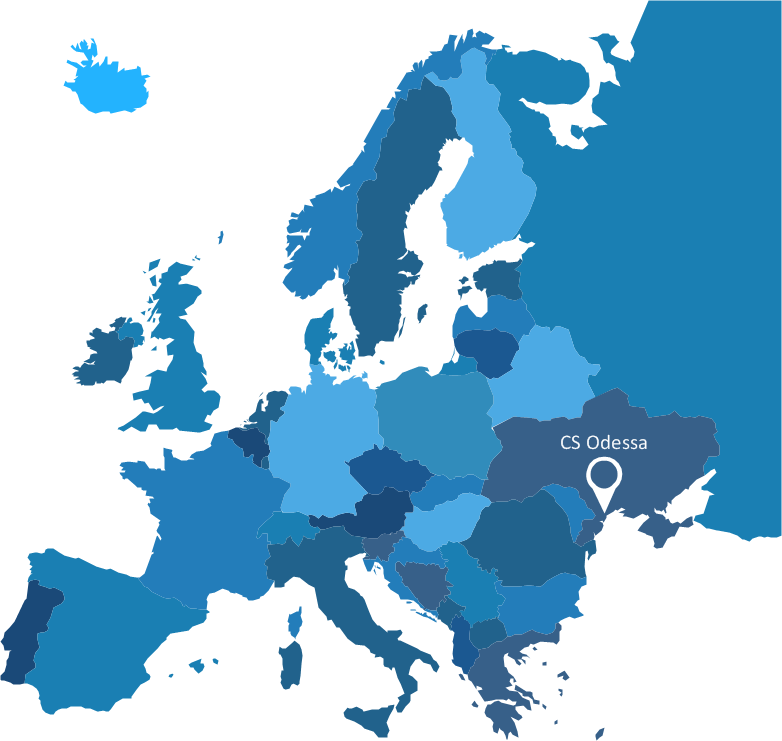
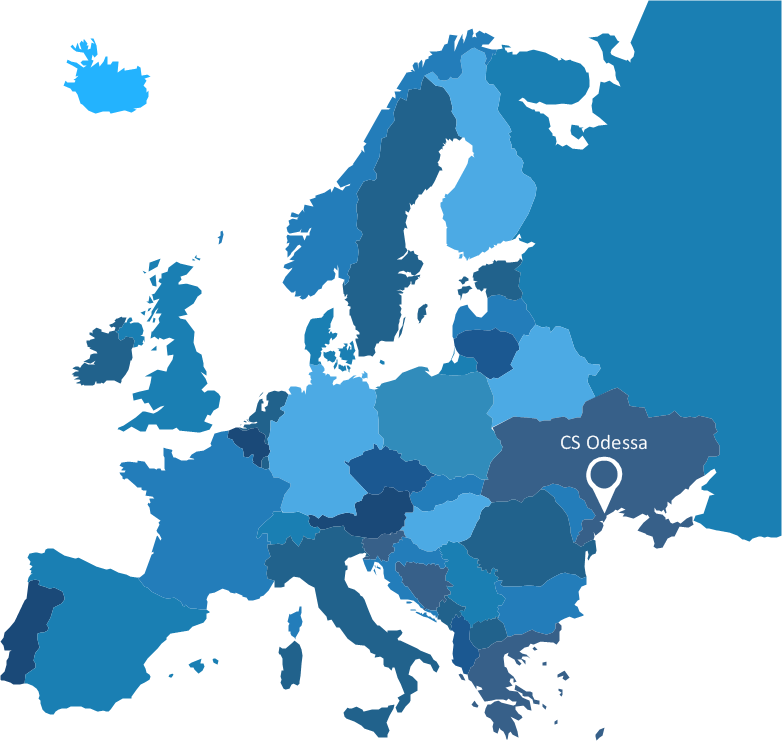
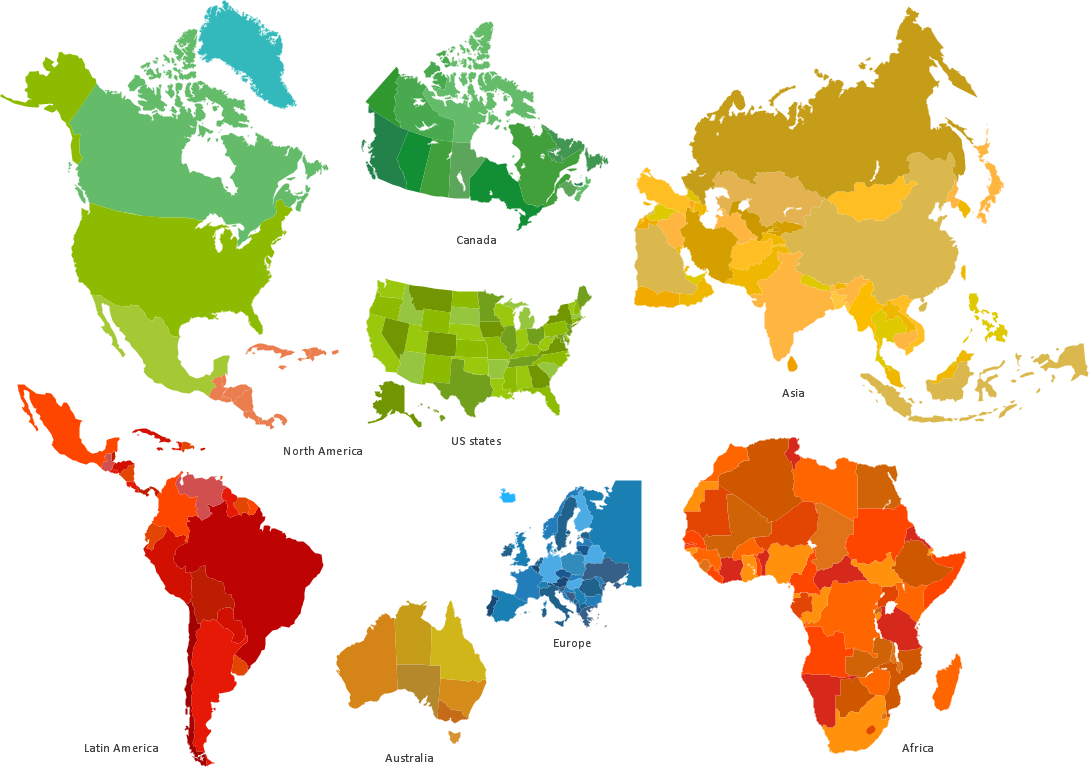
Spatial infographics Design Elements: Continental Map
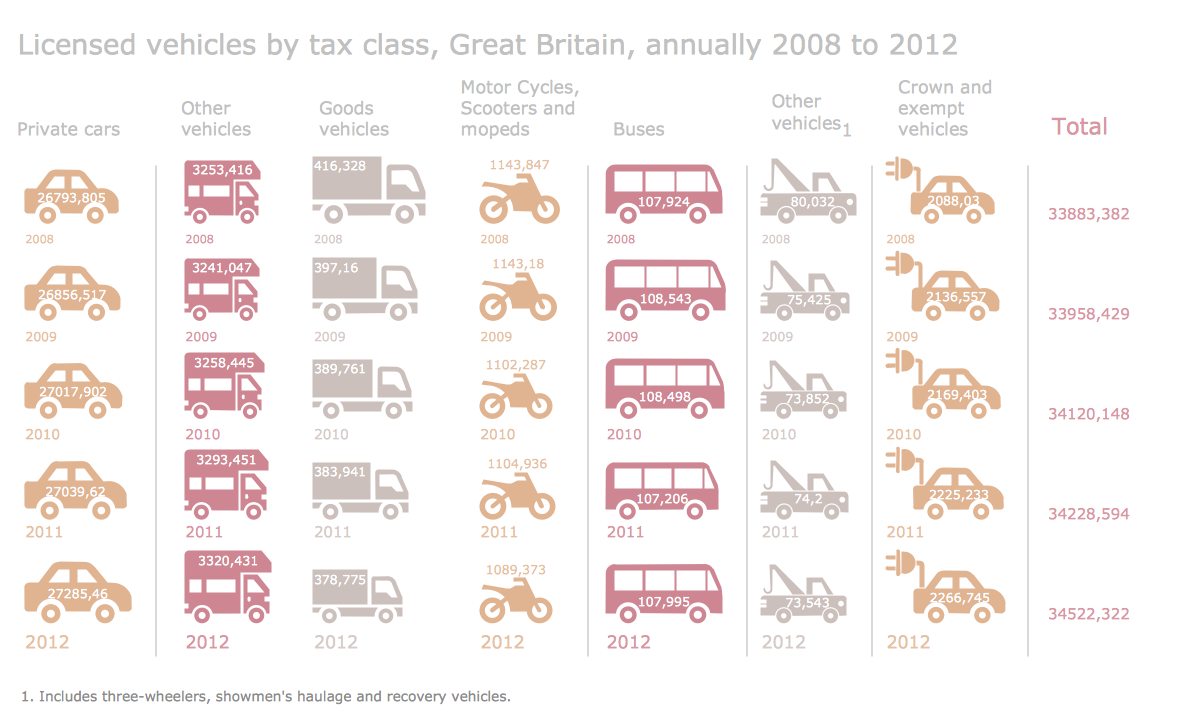
ConceptDraw DIAGRAM is a software for making infographics illustrations. You can work with various components to build really impressive and easy-to-understand infographics design.Superb Examples of Infographic Maps
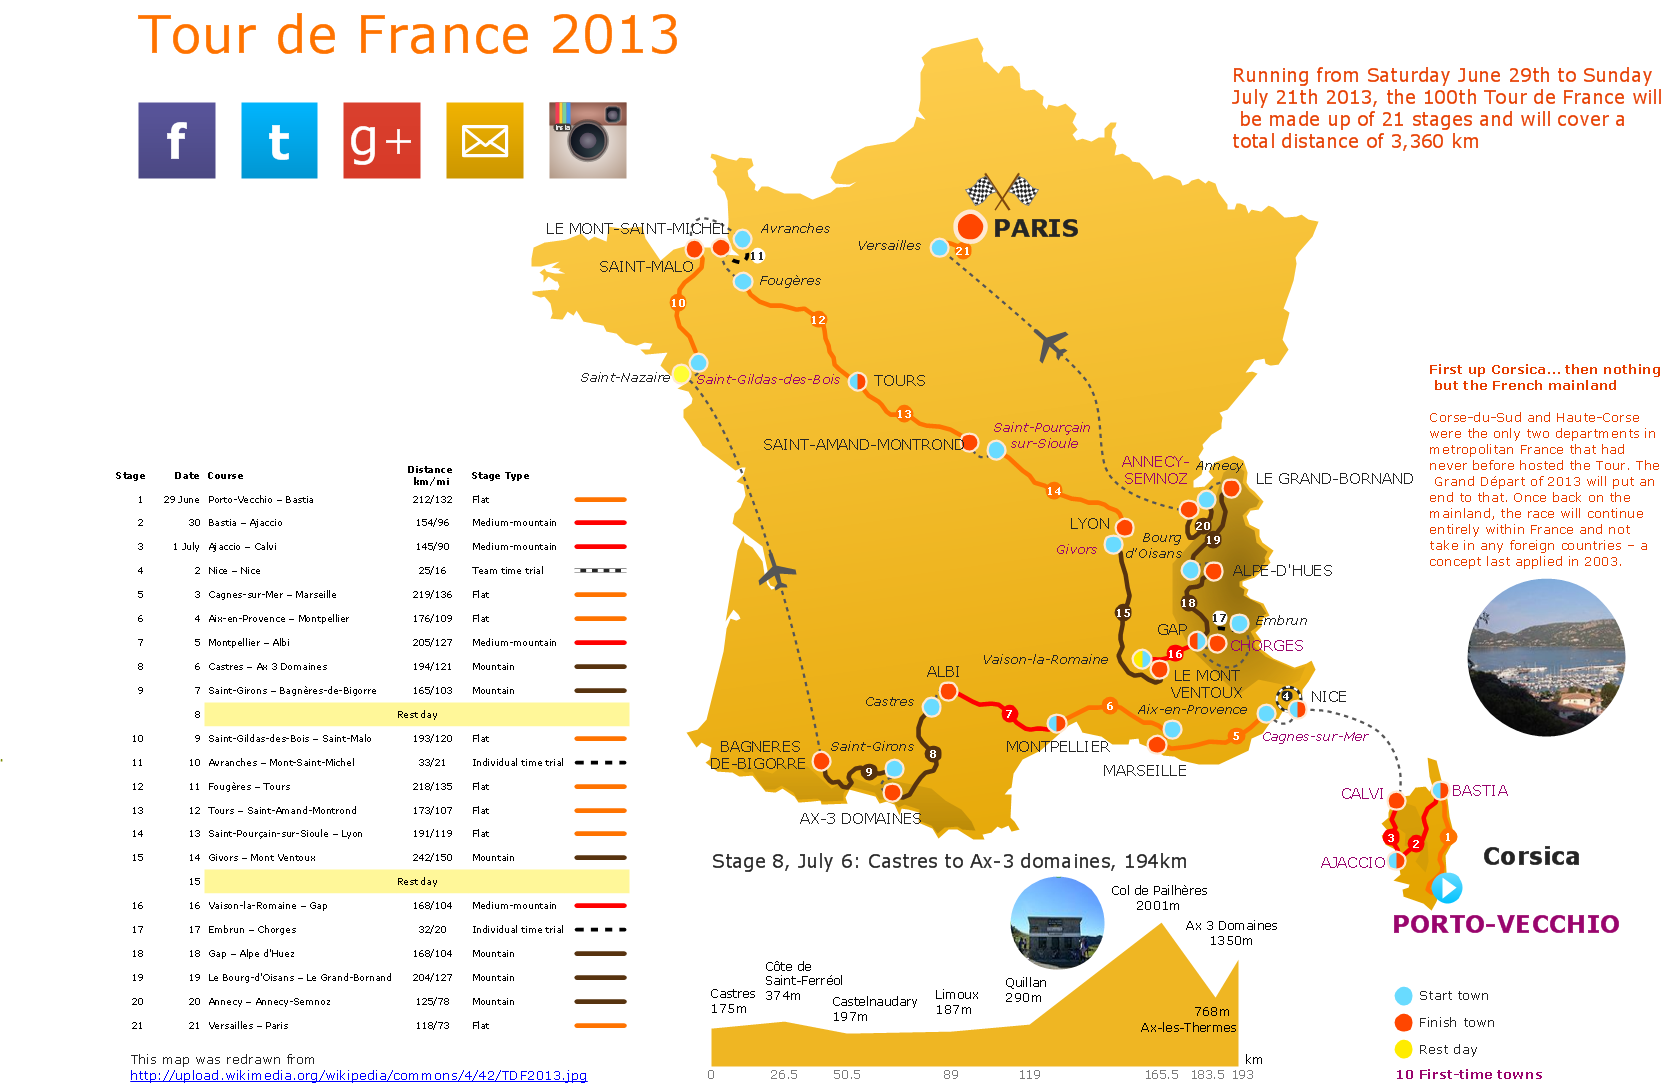
Great examples of Infographic Maps, they are needed for inspiration.Map Infographic Creator
Follow samples and map templates to create nfographic maps. It's super-easy!Best Tool for Infographic Construction
ConceptDraw is a best data visualization tool that will allow everyone to create rich infographics and visualizations quickly and easily.Map Infographic Maker
Take inspiration with ConceptDraw to visualise your maps and make eye-catching infographics.Excellent Examples of Infographic Maps
Create Spatial infographics with ConceptDraw using its excellent examples of infographic maps. We hope these can inspire and teach you!Information Graphics
Creating of professional looking Information Graphics was always been a complex process. But now it's easier than ever thanks to the ConceptDraw DIAGRAM diagramming and vector drawing software extended with Pictorial Infographics Solution from the “Infographics” Area.How to draw Metro Map style infographics? (New York)
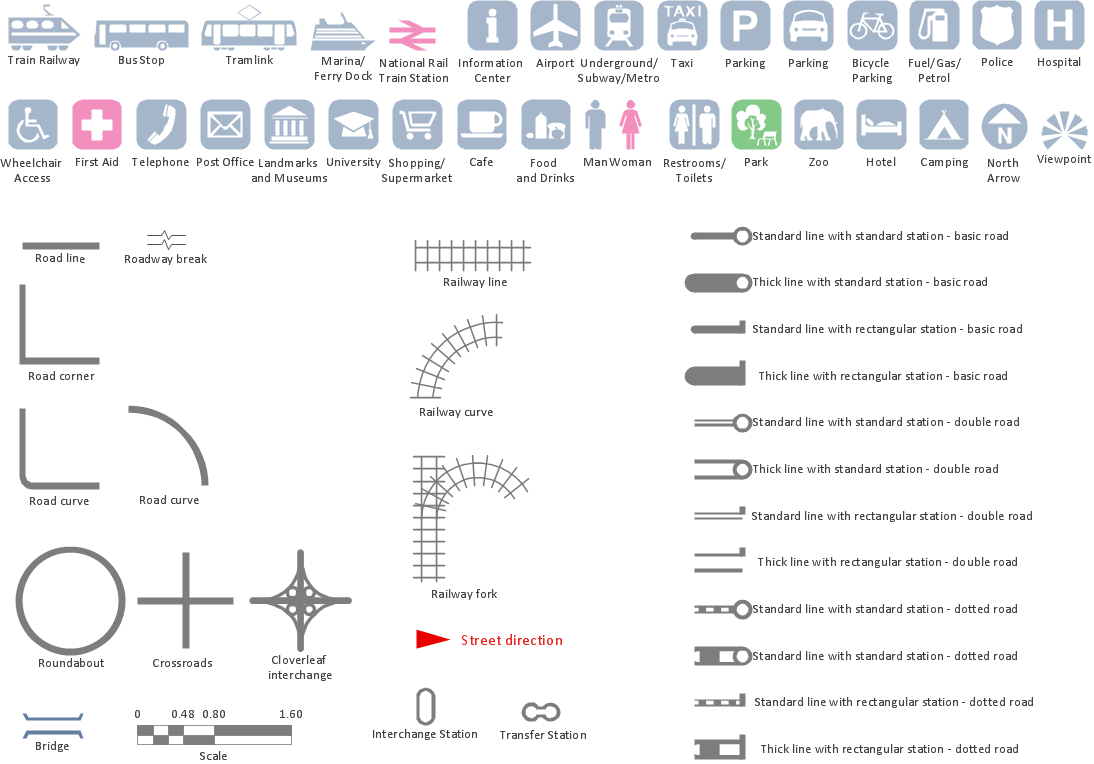
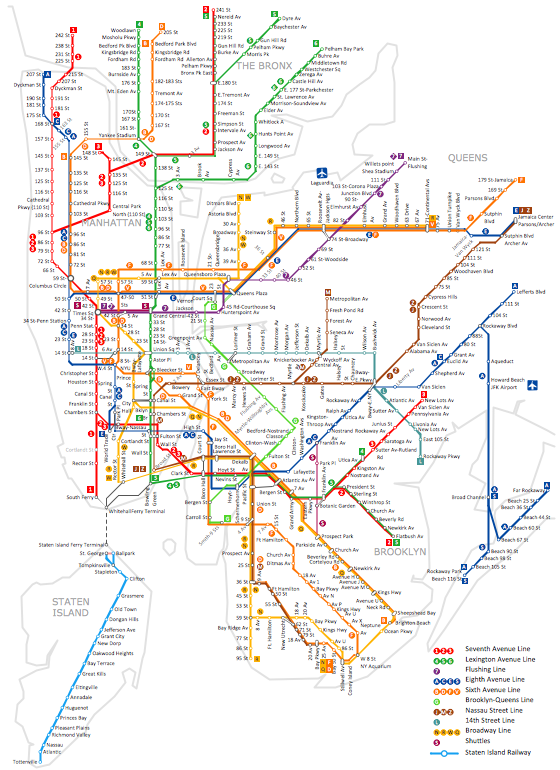
How to draw Metro Map style infographics of New York subway. New York Subway has a long history starting on October 27, 1904. Since the opening many agencies have provided schemes of the subway system. At present time are 34 lines in use. This page present New York City subway map construct with Metro Map Solution in Conceptdraw DIAGRAM software. This is a one-click tool to add stations to the map. It lets you control the direction in which you create new stations, change lengths, and add text labels and icons. It contains Lines, Stations, and Landmarks objectsMap Infographic Tool
ConceptDraw is a data visualization tool, which can help you to create a map infographics. Anyone can do this, it's that easy!HelpDesk
How to Create Infographics Using the Spatial Infographics Solution
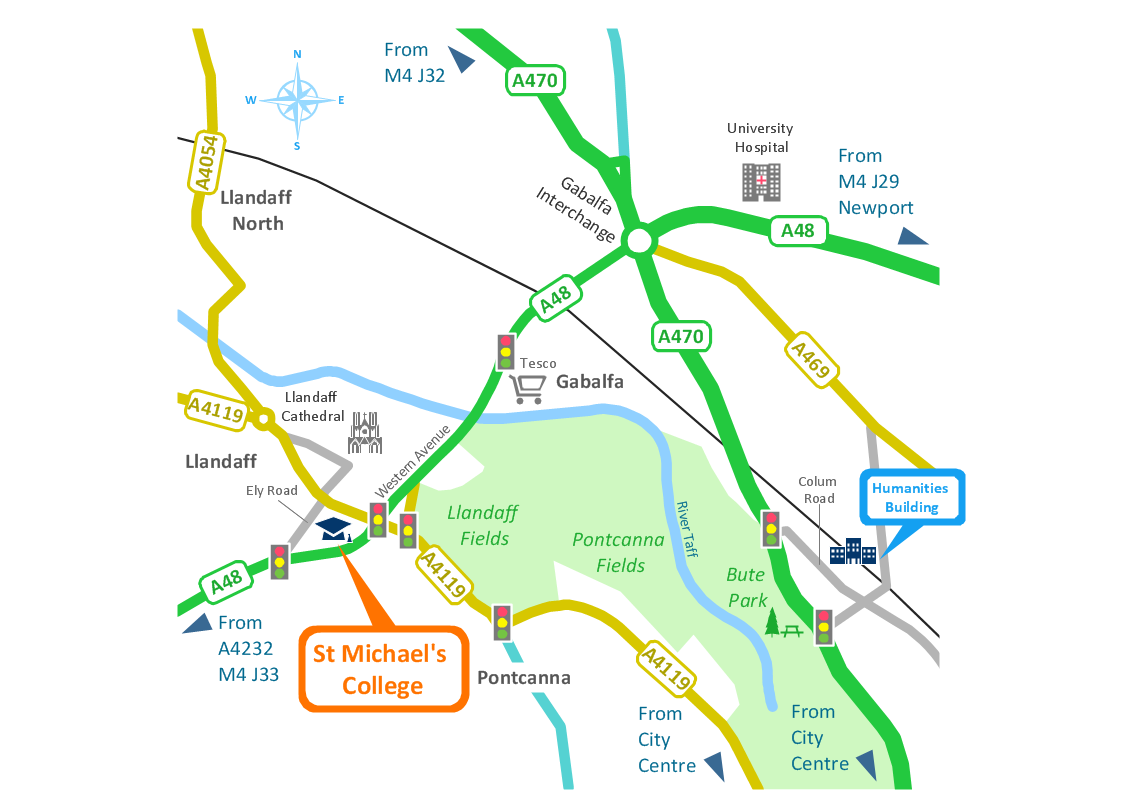
Tips on how to use ConceptDraw Spatial Infographics Solution. Now you got the tool for quick and easy drawing and presenting of your own simple Spatial Infographics documents.Spatial infographics Design Elements: Location Map
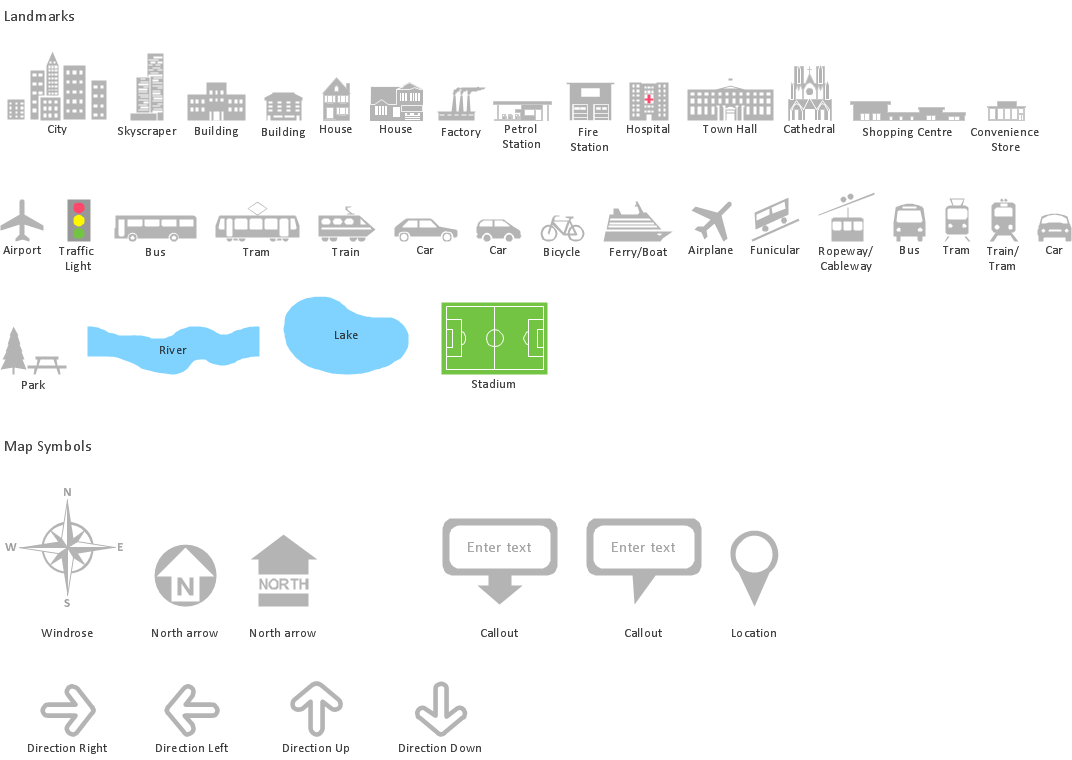
Infographic Design Elements for visually present various geographically distributed information.Visualization Spatial Data Using Thematic Maps Combined with Infographics
Now anyone can build an infographics from their data using ConceptDraw. Nice and simple, but the features it have are power-packed!The vector stencils library "Time and clock pictograms" contains 20 time pictograms: clocks, calendars, day, week, bell, alarm clock, hourglass, wristwatch, and time intervals symbols.
Use it to create temporal infographic, illustrations and diagrams.
The example "Time and clock pictograms - Vector stencils library" was created using the ConceptDraw PRO diagramming and vector drawing software extended with the Pictorial infographics solution from the area "What is infographics" in ConceptDraw Solution Park.
The vector stencils library "Management pictograms" contains 72 management pictograms.
Use it to create your management infogram in the ConceptDraw PRO diagramming and vector drawing software.
The flat icons example "Management pictograms - Vector stencils library" is included in the solution "Marketing infographics" from the "Business infographics" area of ConceptDraw Solution Park.
Use it to create your management infogram in the ConceptDraw PRO diagramming and vector drawing software.
The flat icons example "Management pictograms - Vector stencils library" is included in the solution "Marketing infographics" from the "Business infographics" area of ConceptDraw Solution Park.
Map Infographic Design
ConceptDraw collection of vector elements for infographics design.Infographics and Maps
ConceptDraw is a tool that produces colorful infographics.How tо Represent Information Graphically
ConceptDraw Infographics is a great visual tool for communicating the large amounts of data and graphic visualization and representations of data and information.- Visio Infographic Stencil
- Landmarks - Vector stencils library | Road transport - Vector stencils ...
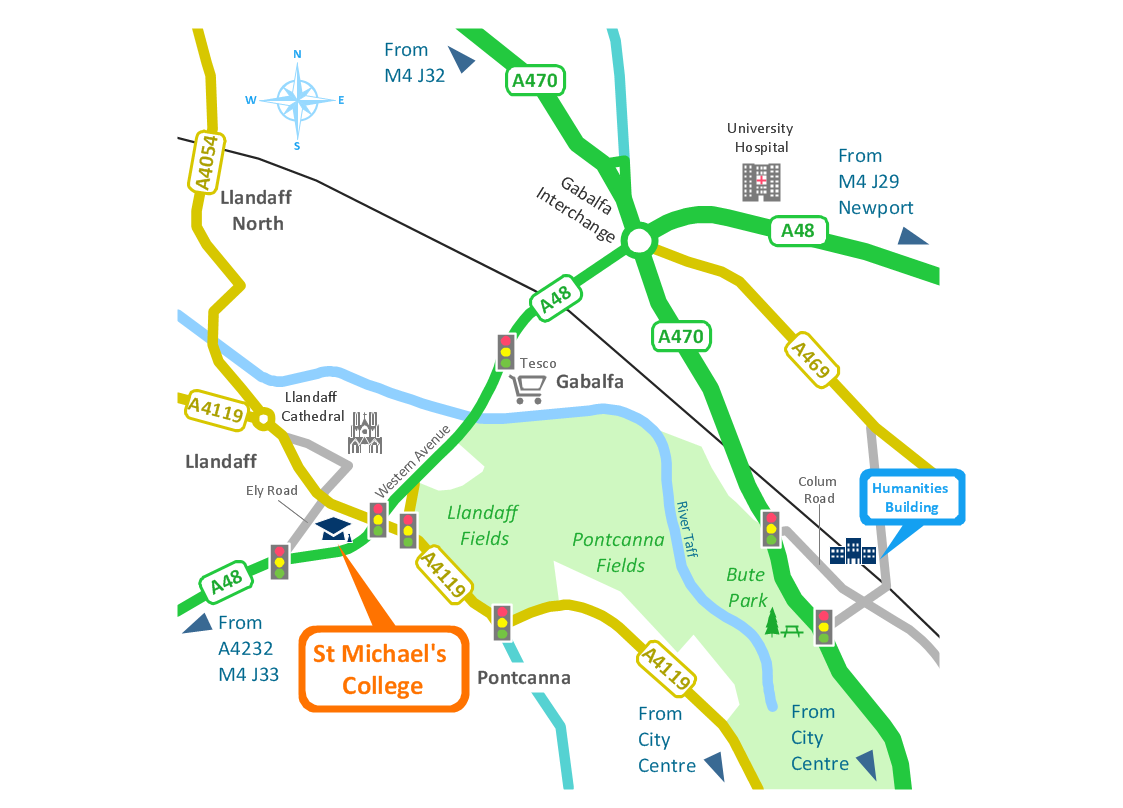
- Map Directions | How to Create a Directional Map Using ...
- North America - Vector stencils library | Latin America - Vector ...
- Road transport - Vector stencils library | Metro Map | Landmarks ...
- Bathroom - Vector stencils library | Network Diagram Examples ...
- Geo Map - Europe - Ireland | South America - Vector stencils library ...
- Directional Maps | Geo Map - World | Spatial Infographics | Visio ...
- Visio Infographic Template
- Office pictograms - Vector stencils library | Design Pictorial ...
- Office pictograms - Vector stencils library | Design Pictorial ...
- Organic Chemistry Symbols | Education pictograms - Vector stencils ...
- Digital audio | Audio - Vector stencils library | Design elements ...
- How to draw Metro Map style infographics ? (New York) | How to ...
- Office pictograms - Vector stencils library | Design elements - Office ...
- Network layout floorplan - Vector stencils library | Spatial ...
- Brilliant Examples of Infographics Map, Transport, Road | Best Tool ...
- Digital audio | Media - Vector stencils library | Design elements ...
- Ecology pictograms - Vector stencils library | Buildings and green ...
- Digital video | Internet - Vector stencils library | Buffering Video ...
