HelpDesk
How to Use ConceptDraw Sales Dashboard Solution

Performance Indicators

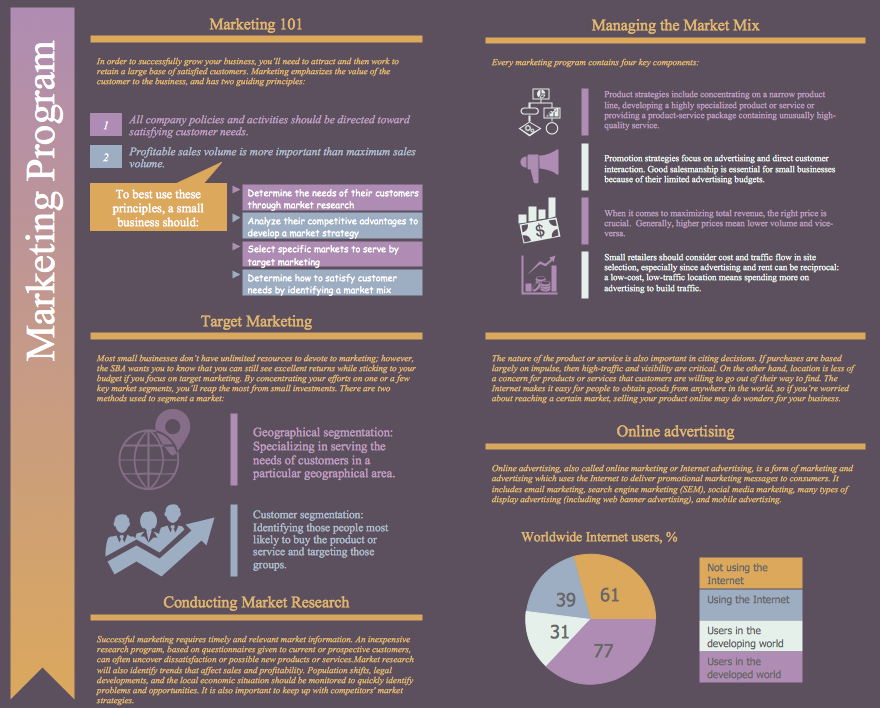
Marketing Plan Infographic
Data Visualization Software Solutions

 Seven Management and Planning Tools
Seven Management and Planning Tools solution extends ConceptDraw DIAGRAM and ConceptDraw MINDMAP with features, templates, samples and libraries of vector stencils for drawing management mind maps and diagrams.
Visualize Sales Data Using Sample Data

 macOS User Interface
macOS User Interface solution extends the ConceptDraw DIAGRAM functionality with powerful GUI software graphic design features and tools. It provides an extensive range of multifarious macOS Sierra user interface design examples, samples and templates, and wide variety of libraries, containing a lot of pre-designed vector objects of Mac Apps icons, buttons, dialogs, menu bars, indicators, pointers, controls, toolbars, menus, and other elements for fast and simple designing high standard user interfaces of any complexity for new macOS Sierra.
Sales Dashboards for Your Company

Sales Dashboard - insight about potential opportunities and key sales operations

- Status Dashboard | Project task status dashboard - Template | PM ...
- Status Dashboard | Project task status dashboard - Template ...
- Status Dashboard | Status indicators - Vector stencils library | Project ...
- PM Dashboards | Project management task status dashboard ...
- Free Project Dashboard Indicators
- Project management task status dashboard | Project task status ...
- Status Dashboard | Project management task status dashboard ...
- Project task status dashboard
- Sales Dashboard Template | Logistic Dashboard | Logistics and ...
- PM Dashboards | How to Create Project Dashboard on Mac | Project ...
- ERD | Entity Relationship Diagrams, ERD Software for Mac and Win
- Flowchart | Basic Flowchart Symbols and Meaning
- Flowchart | Flowchart Design - Symbols, Shapes, Stencils and Icons
- Flowchart | Flow Chart Symbols
- Electrical | Electrical Drawing - Wiring and Circuits Schematics
- Flowchart | Common Flowchart Symbols
- Flowchart | Common Flowchart Symbols