Form Maker
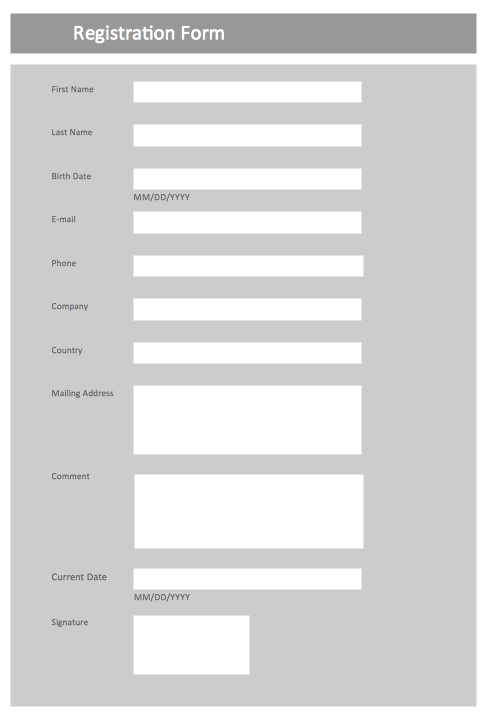
Use the Basic Diagramming Solution from the Universal Diagramming area of ConceptDraw Solution Park to easy create simple forms, questionnaires, survey forms, registration and application forms, etc.ConceptDraw PRO ER Diagram Tool
ER-diagram is a tool used for database modeling which allows to determine data and relationships among the data. These diagrams help to detail data storages and to document all the properties of designed system. ER-diagram contains entities, attributes of the entities and the relationships between them. Chen’s notation and Crow’s foot notation are commonly used to represent elements in ER-model. To create such diagram you should use specific software, such as Entity-Relationship Diagram solution for ConceptDraw Pro.ConceptDraw ER Diagram Tool works across any platform, meaning you never have to worry about compatibility again. ConceptDraw PRO allows you to make Entity-Relationship Diagram (ERD) on PC or macOS operating systems.
Process Flowchart
ConceptDraw is Professional business process mapping software for making process flow diagram, workflow diagram, general flowcharts and technical illustrations for business documents. It is includes rich examples, templates, process flowchart symbols. ConceptDraw flowchart maker allows you to easier create a process flowchart. Use a variety of drawing tools, smart connectors, flowchart symbols and shape libraries to create flowcharts of complex processes, process flow diagrams, procedures and information exchange.
Basic Diagramming
Create flowcharts, org charts, shipping flowcharts, floor plans, business diagrams and more with ConceptDraw. Includes 1000s of professional-looking business templates that you can modify and make your own.
Network Diagram Software Physical Network Diagram
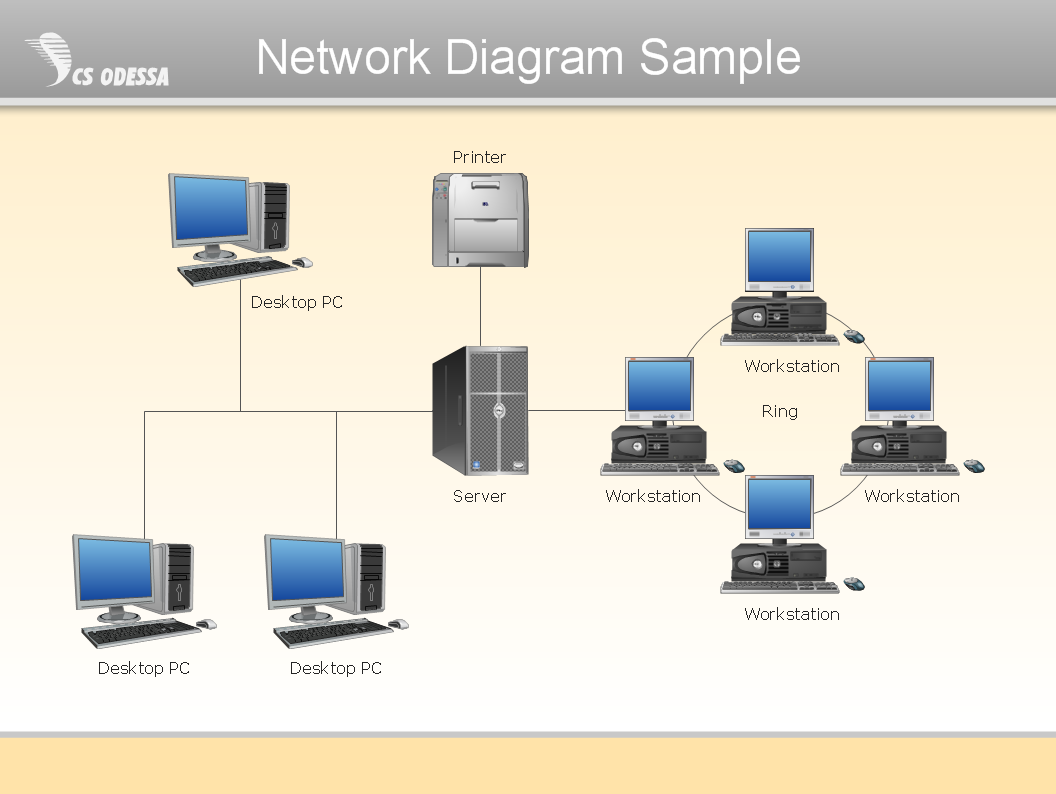
ConceptDraw Network Diagram Software is ideal for network engineers and network designers who need to draw Physical Network Diagrams.
Basic Diagramming
ConceptDraw PRO with the specific tools you need to easily draw flowcharts, block diagrams, bar charts, histograms, pie charts, divided bar diagrams, line graphs, area charts, scatter plots, circular arrows diagrams, Venn diagrams, bubble diagrams, concept maps, electrical circuit diagrams, schematics,and others.Use Basic Diagramming solution to draw you own diagrams, charts and graphs for graphic communication, explanation of business and personal ideas and concepts, simple visual presentation of numerical data, complex structures, logical relations, step-by-step flows of actions or operations.

ER Diagram Tool
Creating of Entity-Relationship Diagrams (ERDs) is a complex process that requires convenient, automated tools. ConceptDraw PRO diagramming and vector drawing software offers a powerful ER Diagram Tool - the Entity-Relationship Diagram (ERD) Solution from the Software Development Area.Network Diagram Software Logical Network
ConceptDraw Network Diagram is ideal for network engineers and network designers who need to draw Logical Network diagrams.
Program Evaluation and Review Technique (PERT) with ConceptDraw PRO
PERT Diagram is a more realistic approach of a project's time estimate analysis. After PERT chart was constructed user can discover the shortest possible duration for entire project timescale. The project timeline is the longest chain that might be taken with connected tasks on the PERT Diagram. Completion of serial tasks need to be accomplished in a presented order. At a project timeline can be independent tasks that not linked with main sequence they are called parallel tasks. PERT diagram is more suitable for Critical Path Analysis than Gantt chart for the reason that it undoubtedly better determine task dependencies. Project managers customarily utilize both methodologies.Organizational Structure
It is not an easy to task to visualize an organizational structure of any company or institution. Sometimes organisational structure could enclose more than thousand persons which work in different departments. Any types of organizational structure can be presented in the form of an organizational chart which creation is supported by ConceptDraw. There are many methods of structuring an organization, determining how it might operate. Often the organizational structure adapts to the production process depending on the type of production and kind of production. The choice of the method depends on the business objectives, dealing with the fact that in the future it will affect organizational action in many ways. First, the structure provides the foundation for standard working operations. Second, it defines the group of people making key decisions in the company, and the extent to which their point of view affects the activities of the organization.- Computer and Networks Area | Form Making Softwares
- Form Creator Software Free
- Free Form Creator Software
- Form Making Software
- Computer and Networks Area | Available Software To Design Form ...
- Flowchart Software Free Download | Online Pdf Form Creator Free
- Flowchart Software Free Download | ConceptDraw Software Full ...
- Employment Form Software | Form Maker | Process Flowchart ...
- Free Form Builder Software Download
- Pyramid Chart Maker | | Form Maker | Graphic Maker
- ERD | Entity Relationship Diagrams, ERD Software for Mac and Win
- Flowchart | Basic Flowchart Symbols and Meaning
- Flowchart | Flowchart Design - Symbols, Shapes, Stencils and Icons
- Flowchart | Flow Chart Symbols
- Electrical | Electrical Drawing - Wiring and Circuits Schematics
- Flowchart | Common Flowchart Symbols
- Flowchart | Common Flowchart Symbols


