Flowchart Symbols Accounting. Activity-based costing (ABC) flowchart

"In elementary algebra, a quadratic equation (from the Latin quadratus for "square") is any equation having the form
ax^2+bx+c=0
where x represents an unknown, and a, b, and c are constants with a not equal to 0. If a = 0, then the equation is linear, not quadratic. The constants a, b, and c are called, respectively, the quadratic coefficient, the linear coefficient and the constant or free term.
Because the quadratic equation involves only one unknown, it is called "univariate". The quadratic equation only contains powers of x that are non-negative integers, and therefore it is a polynomial equation, and in particular it is a second degree polynomial equation since the greatest power is two.
Quadratic equations can be solved by a process known in American English as factoring and in other varieties of English as factorising, by completing the square, by using the quadratic formula, or by graphing." [Quadratic equation. Wikipedia]
The flowchart example "Solving quadratic equation algorithm" was created using the ConceptDraw PRO diagramming and vector drawing software extended with the Mathematics solution from the Science and Education area of ConceptDraw Solution Park.
Solving quadratic equation flow chart

Geo Map — South America Continent
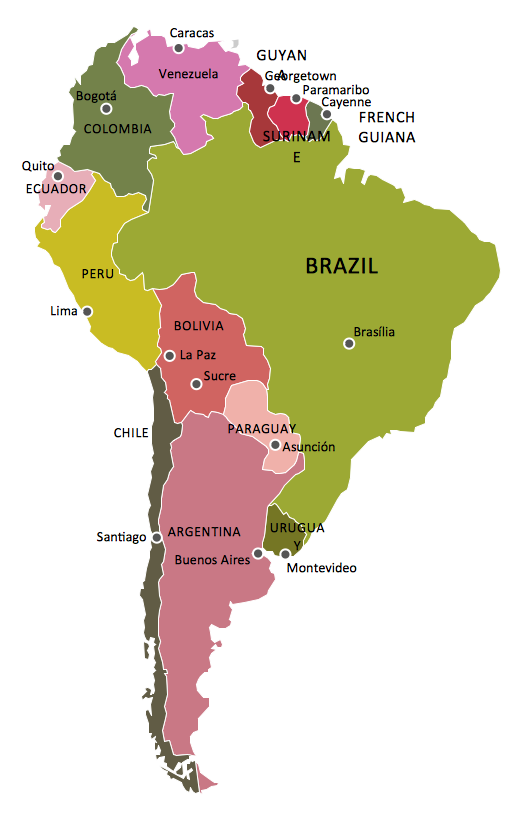
ConceptDraw DIAGRAM is idea to draw the geological maps of South America continent from the pre-designed vector geo map shapes.
Use Continent Maps solution from the Maps area of ConceptDraw Solution Park to draw thematic maps, geospatial infographics and vector illustrations for your business documents, presentations and websites.
 Illustration
This solution extends ConceptDraw DIAGRAM.4, allowing you to make professional-looking documents, presentations and websites illustrated with color, scalable vector clip art and shapes, regardless of drawing skills.
 Artwork
Artwork solution extends ConceptDraw DIAGRAM software with illustration samples, templates and libraries of vector clipart of architecture, food, music, funny animals, aquatic fauna and transport.
- Basic Flowchart Symbols and Meaning | Flowchart design ...
- Basic Flowchart Symbols and Meaning | Flowchart Symbols ...
- Flowchart Symbols Accounting. Activity-based costing ( ABC ...
- Accounting Flowcharts | Flowchart Symbols Accounting. Activity ...
- Process Flowchart | Flowchart Symbols Accounting. Activity-based ...
- Accounting Flowchart | Flowchart Symbols Accounting. Activity ...
- Process Flowchart | Flowchart Symbols Accounting. Activity-based ...
- Process Flowchart | Flowchart Symbols Accounting. Activity-based ...
- UML object diagram - Estimating scenario | Flowchart Symbols ...
- Accounting Flowcharts | Flowchart Symbols Accounting. Activity ...
- Process Flowchart | Flowchart Symbols Accounting. Activity-based ...
- Pyramid Diagram | Flowchart Symbols Accounting. Activity-based ...
- Basic Flowchart Symbols and Meaning | Flowchart design ...
- Basic Flowchart Symbols and Meaning | How to Create Flowchart ...
- Process Flowchart | Basic Flowchart Symbols and Meaning ...
- Accounting Flowcharts | Basic Flowchart Symbols and Meaning ...
- Process Flowchart | Flow chart Example. Warehouse Flowchart ...
- DFD - Process of account receivable | Data Flow Diagrams ...
- Basic Flowchart Symbols and Meaning | Entity Relationship ...
- Flow chart Example. Warehouse Flowchart | Material Requisition ...
- ERD | Entity Relationship Diagrams, ERD Software for Mac and Win
- Flowchart | Basic Flowchart Symbols and Meaning
- Flowchart | Flowchart Design - Symbols, Shapes, Stencils and Icons
- Flowchart | Flow Chart Symbols
- Electrical | Electrical Drawing - Wiring and Circuits Schematics
- Flowchart | Common Flowchart Symbols
- Flowchart | Common Flowchart Symbols