Circle Diagrams
The Circle Diagrams are the diagrams which represent the central element surrounded by other items in a circle. This type of diagram is very popular and widely used in marketing and management, for process modeling, market, resource, time and cost analysis, for visualization causes and effects. If you dream to design the Circle Diagrams quick and easy – the ConceptDraw DIAGRAM software extended with Circle-Spoke Diagrams Solution from the "Diagrams" Area is exactly what you need.
 Circle-Spoke Diagrams
Examples of subject areas that are well suited to this approach are marketing, business, products promotion, process modeling, market, resource, time, and cost analysis. Circle-Spoke Diagrams are successfully used in presentations, conferences, management documents, magazines, reportages, reviews, reports, TV, and social media.
Target Diagram
Target Diagram is a convenient and visual way of presentation information which is popular and widely used in marketing, business and economics. ConceptDraw DIAGRAM diagramming and vector drawing software extended with Target and Circular Diagrams solution from the Marketing area of ConceptDraw Solution Park is ideal for fast and easy drawing a Target Diagram.The Circular Flow Diagram
ConceptDraw DIAGRAM diagramming and vector drawing software extended with Target and Circular Diagrams solution from the Marketing area of ConceptDraw Solution Park is perfect for the Circular Flow Diagram creating.3 Circle Venn. Venn Diagram Example
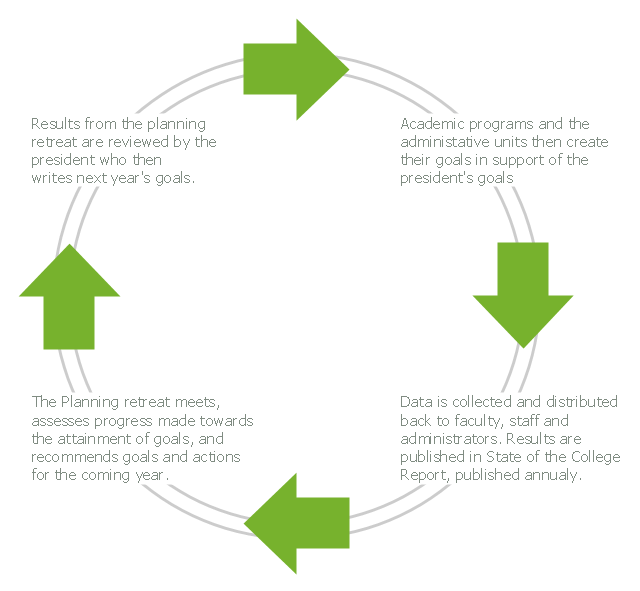
This example shows the 3 Circle Venn Diagram. The Venn Diagrams visualize all possible logical intersections between several sets. On this example you can see the intersections of 3 sets. Venn Diagrams are widely used in mathematics, logic, statistics, marketing, sociology, etc.This arrow circle diagram example was created on the base of the figure illustrating the webpage "Institutional Planning" from the Southside Virginia Community College website. "Planning at SVCC is a continuing process which is directed by four main influences. First, the President publishes the college's goals for the upcoming year. Second, academic programs and administrative units publish goals within their area of responsibility in support of the President's goals. Third, data on the college's students, programs, and initiatives are collected by a variety of studies and reports. Suggestions are also gathered from various stakeholders for the planning committee to consider. Fourth, the planning committee summarizes the information collected and the progress on meeting the current college goals. The committee then recommends items for the annual planning retreat to address. The planning retreat takes the recommendations of the planning retreat and publishes a planned response to ensure the attainment of the president's goals and to address the issues raised by the input process."
[southside.edu/ institutional-planning]
The arrow circle diagram example "Program assessment plan" was created using the ConceptDraw PRO diagramming and vector drawing software extended with the Target and Circular Diagrams solution from the Marketing area of ConceptDraw Solution Park.
www.conceptdraw.com/ solution-park/ marketing-target-and-circular-diagrams
Flow Chart Creator
ConceptDraw DIAGRAM is a flowchart design software. There are large collections of professional flowchart symbols for process flow diagrams, standard flowchart symbols and colored basic flowchart symbols. Built-in examples and video lessons allow users to get started immediately and do drawing of virtually any type of flowchart or process flow diagrams
 Circular Arrows Diagrams
Circular Arrows Diagrams solution extends ConceptDraw DIAGRAM with extensive drawing tools, predesigned samples, Circular flow diagram template for quick start, and a library of ready circular arrow vector stencils for drawing Circular Arrow Diagrams, Segmented Cycle Diagrams, and Circular Flow Diagrams. The elements in this solution help managers, analysts, business advisers, marketing experts, scientists, lecturers, and other knowledge workers in their daily work.
Basic Diagramming
Perfect charts and graphics diagramming software with rich examples and template. ConceptDraw is ideal to draw Charts and Graphics.
Entity Relationship Diagram Symbols
Creating an entity-relationship (ER) model is to visually represent the structure of a business database, where data equates to entities (or objects) that are linked by defined relationships expressing dependencies and requirements. By nature it is an abstract visualization, the first step in the design process towards creating a logical and functional database.ERD symbols used for professional ERD drawing are collected in libraries from the Entity-Relationship Diagram (ERD) solution for ConceptDraw DIAGRAM.
- Circle Diagram Maker
- Arrow circle chart - Template | Program assessment plan - Arrow ...
- Cycle Diagram Creator
- Arrow circle chart - Template | How to Draw a Circular Arrows ...
- Draw A Diagram Explain To Him The Accounting Cycle
- Target and Circular Diagrams | Circular Flowchart Visio
- Circular Flow Diagram Template
- How to Draw a Circular Arrows Diagram Using ConceptDraw PRO ...
- How To Create a Visio Circle -Spoke Diagram Using ConceptDraw ...
- How to Draw a Circle -Spoke Diagram Using ConceptDraw PRO ...
- ERD | Entity Relationship Diagrams, ERD Software for Mac and Win
- Flowchart | Basic Flowchart Symbols and Meaning
- Flowchart | Flowchart Design - Symbols, Shapes, Stencils and Icons
- Flowchart | Flow Chart Symbols
- Electrical | Electrical Drawing - Wiring and Circuits Schematics
- Flowchart | Common Flowchart Symbols
- Flowchart | Common Flowchart Symbols


