Venn Diagram
Venn Diagrams are illustrations used in the branch of mathematics known as set theory. They show the mathematical or logical relationship between different groups of things (sets).
A Venn Diagram was introduced by the British philosopher and mathematician John Venn
(1834-1923) in 1881 and visually shows all the possible logical relations between the sets. This diagram can be interpreted as the relationships of sets which may have some (but not all) elements in common.

Example 1. Venn Diagram — Relationship Marketing
The combined area of sets in a Venn Diagram is called the union of sets. Sometimes there is a rectangle around the Venn diagram to show the space of all possible elements. This rectangle represents so-called Universal set. A Venn Diagram is usually used to divide up two or more objects to highlight similarities and differences.
Venn Diagrams visualize all the possible logical relations between sets. They are used to illustrate simple set relationships in logic, statistics, mathematics, sociology, philosophy, marketing, etc. Venn Diagrams are also commonly used to visually summarize the status and future viability of a project.

Example 3. Venn Diagram — Sustainable Development
There are some similar diagram types, based on Venn Diagram:
- Euler diagrams similar to Venn Diagrams, but they may not describe all the possible relations.
- Johnston diagrams, which are used to illustrate statements in propositional logic, such as "Neither A nor B is true", and are a visual way of illustrating truth tables.
- Karnaugh maps or Veitch diagram are another way of visually representing Boolean expressions.
- Peirce diagrams, devised by Charles Peirce, are extensions to Venn diagrams which include information on existential statements, disjunctive information, probabilities, and relations.

Example 3. Venn Diagram — Knowledge
This simple example was created in ConceptDraw DIAGRAM using the Business Diagrams Solution. It shows the use of Venn Diagram to compare two people groups. One circle represents all the information people know about the stock market in Britain, the other circle represents all the information they know about stock market in Germany. Any features the two areas share can be written in the intersection of the circles. The result shows at a glance what the two markets have in common and what features are different.
Use Business Diagrams solution to quick and easy design your own Venn Diagram of any complexity.
The Venn Diagrams designed with ConceptDraw DIAGRAM are vector graphic documents and are available for reviewing, modifying, converting to a variety of formats (image, HTML, PDF file, MS PowerPoint Presentation, Adobe Flash or MS Visio), printing and send via e-mail in one moment.
TEN RELATED HOW TO's:
Collaborating with co-workers is very important, not only in order to get things done effectively, but also to keep in touch with the outside world. Great way for business collaboration is Skype.
Picture: Online Collaboration via Skype
Related Solution:
ConceptDraw DIAGRAM software extended with Business Diagrams solution offers a wide set of professionally designed Venn Diagram examples which can become the good start and beautiful source of inspiration for your own Venn Diagrams.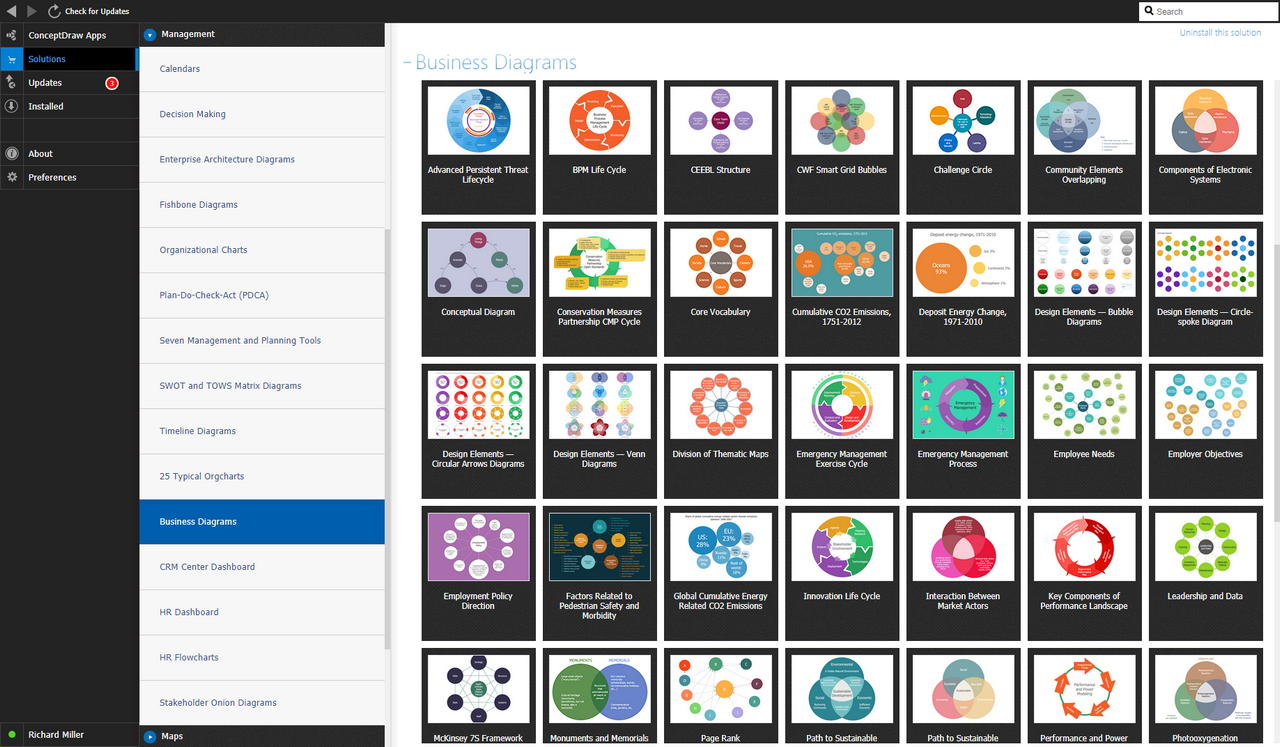
Picture: Venn Diagram Examples
Related Solution:
ConceptDraw PROJECT is a vigorous tool for managing single or multiple projects. It lets you determine all essential elements involved into project, control schedules, resources and finances, and monitor projects' progress in most effective yet simple manner.
Picture: Product Overview
Workflow Diagram - workflow process diagram is a visual representation of a organizational process flow. Often it used as the same visual notation as process flow diagram. Visualising business processes using workflow diagram (workflow process diagram) allows estimate business process efficiency, analyse and optimize the process itself. Workflow diagram helps get focusing on each step and relations between workflow steps. ConceptDraw DIAGRAM is software for making workflow diagram. It contains specific designed graphics to draw workflow diagrams effectively. This is workflow diagram maker which do your work process effective.
Picture: Work Flow Process Chart
Related Solution:
Problems are obstacles and challenges that one should overcome to reach the goal. They are an inseparable part of any business, and the success of an enterprise often depends on ability to solve all problems effectively. The process of problem solving often uses rational approach, helping to find a suitable solution.
Using Fishbone Diagrams for Problem Solving is a productive and illustrative tool to identify the most important factors causing the trouble. ConceptDraw DIAGRAM extended with Fishbone Diagrams solution from the Management area of ConceptDraw Solution Park is a powerful tool for problem solving with Fishbone Ishikawa diagram graphic method.
Picture: Using Fishbone Diagrams for Problem Solving
Related Solution:
Use Case Diagrams technology. IDEF4 standard implies not only graphical presentation but the additional information about diagrams of heredity, methods systematization and types which are contained in specifications.
Picture: IDEF4 Standard
When you need to visually represent the structure of relational database, Entity relationship diagram (ERD) is a type of diagram for that case.
Most entity-relationship diagrams can be built with objects from Flowchart solution or ERD Solution which contains inbuilt templates. Follow these steps to create your own custom ERD diagram.
Don't be frightened if it looks complex, ConceptDraw DIAGRAM makes it easy to create an ERD, and hundreds of other diagrams, in minutes.
Picture: Developing Entity Relationship Diagrams
Related Solution:
Event-Driven Process Chain Diagrams for improvement throughout an organisation.
ConceptDraw DIAGRAM - software that reduces the time needed to create a business process model.
Picture: Beauty of Event-driven Process Chain (EPC) diagrams
Related Solution:
Use the set of special professionally developed swim lane flowchart symbols - single, multiple, vertical and horizontal lanes from the Swimlanes and Swimlanes BPMN 1.2 libraries from the Business Process Diagram solution, the Swim Lanes library from the Business Process Mapping solution as the perfect basis for your Swim Lane Flowcharts of processes, algorithms and procedures.
Picture: Swim Lane Flowchart Symbols
Related Solution:
The Process Flowchart or Process Flowchart Diagram (PFD) is a visual representation relations between major parts of the system, the steps in a process, and even connections between various systems. The possibility to easy create professional-looking and attractive Process Flowcharts, Business Process Diagrams and Maps which visualize the steps of complex processes is provided by Business Process Diagram Solution from the Business Processes Area of ConceptDraw Solution Park and 16 libraries with 230 process flowchart symbols from BPMN 1.2 and BPMN 2.0.
Picture: Process Flowchart Symbols
Related Solution:

