
Example 1. Use a Fishbone Diagram to Attack Complex Problems
Fishbone Diagrams Solution for ConceptDraw DIAGRAM and its Fishbone Diagrams library will help you construct and use a Fishbone diagram to attack complex problems. First, draw the long horizontal arrow, you can use the predesigned object from the library. Then define the causes using brainstorming session (it is convenient to use ConceptDraw MindMap application for brainstorming) or any other way, combine them into categories and represent on the diagram as "fish bones". Then analyze and sort defined causes, visualize relationships between causes and effects, and now easy find solution of considered complex problem.

Example 2. Fishbone Diagrams Library Design Elements
You can also create professional Fishbone diagrams using software templates. To help you with analisys and troubleshooting, we created Fishbone, Cause and Effect fishbone, Ishikawa diagram examples and many more.

Example 3. Fishbone Diagrams to Attack Complex Problems
The samples you see on this page were created in ConceptDraw DIAGRAM using the Fishbone Diagrams Solution and illustrate the use a Fishbone Diagram to Attack Complex Problems. An experienced user spent 10 minutes creating each of these samples.
Use the Fishbone Diagrams Solution for ConceptDraw DIAGRAM Solution Park to solve problems using the cause-and-effect diagrams fast and easy.
All source documents are vector graphic documents. They are available for reviewing, modifying, or converting to a variety of formats (PDF file, MS PowerPoint, MS Visio, and many other graphic formats) from the ConceptDraw STORE. The Fishbone Diagrams Solution is available for all ConceptDraw DIAGRAM or later users.
TEN RELATED HOW TO's:
Food courts are one of the most rapidly developing areas of the restaurant business. ConceptDraw DIAGRAM diagramming and vector drawing software offers a Food Court solution from the Food and Beverage area with wide capabilities for planning, design, developing and advertising of a Food Court.
Picture: Food Court
Related Solution:
Functional modeling allows to make complex business processes simple. One of the basic methods is IDEF0 and one of the most effective also. To create a business model, use flowchart symbols.
The IDEF0 library, supplied with ConceptDraw IDEF0 Diagrams solution contains 18 IDEF0 basic notation symbols. All symbols are the vector graphic images what means, that one can customize their size preserving the stable quality. Another library of IDEF0 symbols can be find out in the the Business Process Diagrams solution, included to the Business Processes section of ConceptDraw Solution Park. These libraries composed from just vector objects and are totally compatible. You can apply the IDEF0 symbols from both libraries at your flowcharts, if needed.
Picture: IDEF0 Flowchart Symbols
Related Solution:
ConceptDraw DIAGRAM is a powerful software for creating professional looking Flowcharts quick and easy.
Picture:
Flowchart
What is Flowchart
Related Solution:
This sample shows the Flowchart that displays the solid-state welding processes, the types of welding.
Picture: Types of Welding in Flowchart
Related Solution:
Decision Making - ConceptDraw OFFICE suite provides visual tools that are given support on the stage of the decision making.
The Seven Management and Planning Tools is a set for such diagrams: Affinity Diagram, Relations Diagram, Prioritization Matrix, Root Cause Tree Diagram, Involvement Matrix, PERT Chart, Risk Diagram (PDPC).
Picture: Decision Making
The Cause and Effect diagram introduced by Kaoru Ishikawa in 1968 is a method for analyzing process dispersion. It can help you to dive into a problem and find an effective solution, identify and represent the possible causes for an effect, analyze the complex business problems and successfully solve them.
You can design your Cause and Effect diagram on a paper, but more effective way is to use specific software - ConceptDraw DIAGRAM is a powerful Cause and Effect Diagram Software. It helps you create Cause and Effect diagram known also as Fishbone diagram or Ishikawa diagram from templates and examples.
Picture: Cause and Effect Diagram Software
Related Solution:
Local area network connects computers and other network appliances within an area, such as office building or a campus. It can be difficult to provide such network without a predesigned plan. For these purposes you can use network diagram software, which helps you to create LAN network diagrams and office network diagrams quickly and effortless. This will speed up your work and you can save the diagram for the future network improvements.
The following diagram illustrates a network topology of the small office. LAN configuration has a star topology. The local network joins 8 computers among which are several desktop PCs, laptop, two iMacs and iBook. The end-point devices are divided into three groups. Each group is connected to its hub. There is a network printer and a modem, which are interconnected with other devices through a network server. Each computer on the LAN can access the server through a corresponding hub.
Picture: Network Diagram Software. LAN Network Diagrams. Physical Office Network Diagrams
Related Solution:
Use diagrams and infographics designed in ConceptDraw DIAGRAM to explain efficiently ✔️ basics of the baseball game, ✔️ rules, ✔️ positions, ✔️ strategies, ✔️ defensive and offensive insights, ✔️ game situations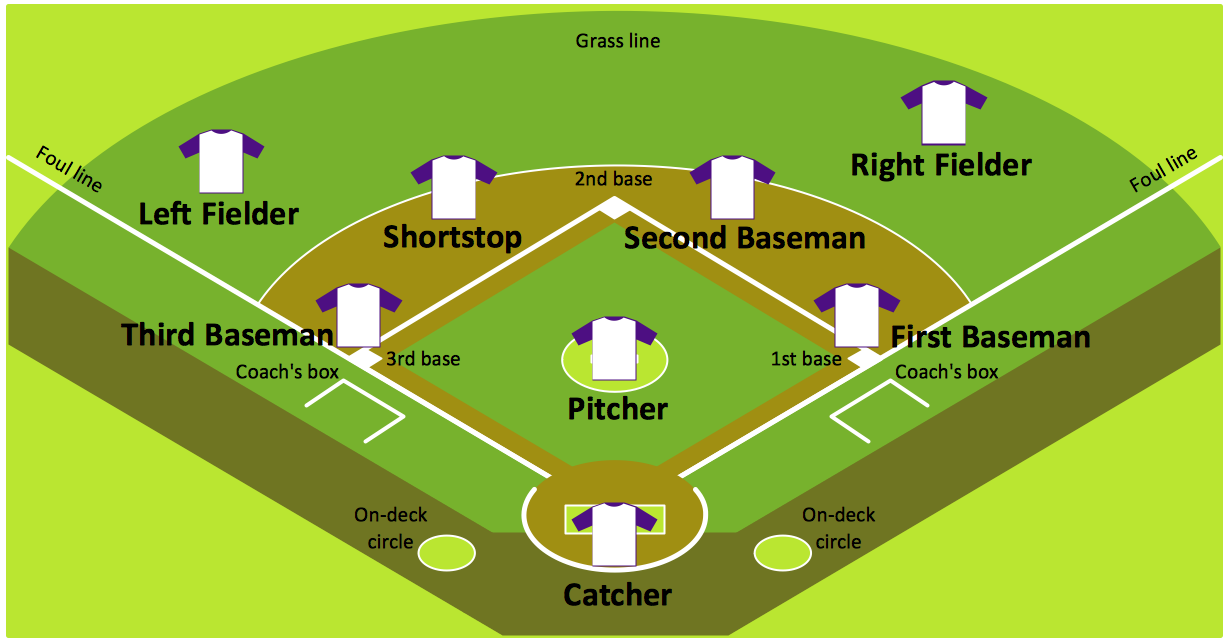
Picture:
Baseball Diagram
Baseball Field — Corner View — Sample
Related Solution:
Fishbone Diagram is another name for the Cause and Effect Diagram or the Ishikawa Diagram which got its name from the fact that it looks like a fish skeleton. Developed by Kaoru Ishikawa in 1968, a Fishbone Diagram is effectively used for a cause and effect analysis which allows to consider all possible causes for a certain problem or event.
ConceptDraw DIAGRAM supplied with Fishbone Diagrams solution from the Management area is the best software for fast and easy drawing professional looking Fishbone Diagram.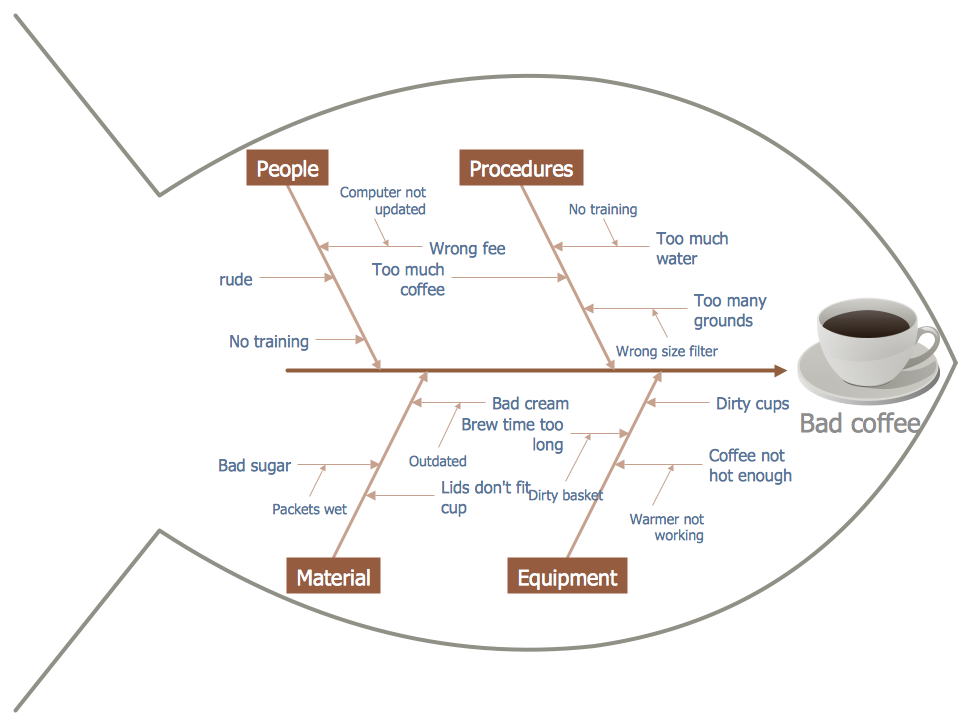
Picture: Fishbone Diagram
Related Solution:
This sample represents the actors, use cases and dependencies between them, and also the relationships between use cases. There are used dependency and use case generalization associations on this UML diagram. Use case generalization is used when you have two similar use cases, but one of them does more than another.
This sample shows the work of the Financial Trade sphere and can be used by trading companies, commercial organizations, traders, different exchanges.
Picture: Financial Trade UML Use Case Diagram Example

