Process Flow Chart
What is a Process Flow Chart
A Process Flow Chart or PFD is a type of Flowchart that is mostly used in industrial, chemical, and process engineering to illustrate high-level processes and major plant processes, not showing minor details.
A Process Flow Chart is often used:
- to describe actions that occur when a physical process takes place;
- to help identify waste when analyzing the steps of the process and then eliminate them;
- to show several decisions when a process is sequential.
Process Flowcharts are used mainly in process engineering and chemical industry where there is a requirement to depict relationships between major components, major parts of the system. Process Flowcharts for single units or multiple units differ in their structure and implementation.
Process Flow Diagram presents the relationships with components in the schematic drawings and usually consists of:
- process piping;
- major equipment items, symbols, names, identification numbers;
- control valves and other major valves;
- recirculation streams and major bypass;
- flow directions;
- interconnections with other systems;
- the set of operational data — pressure, temperature, flow rate, density, etc.
ConceptDraw DIAGRAM software extended with Flowcharts Solution from the Diagrams area of ConceptDraw Solution Park is the best way to create Process Flow Chart and other types of Flowcharts.

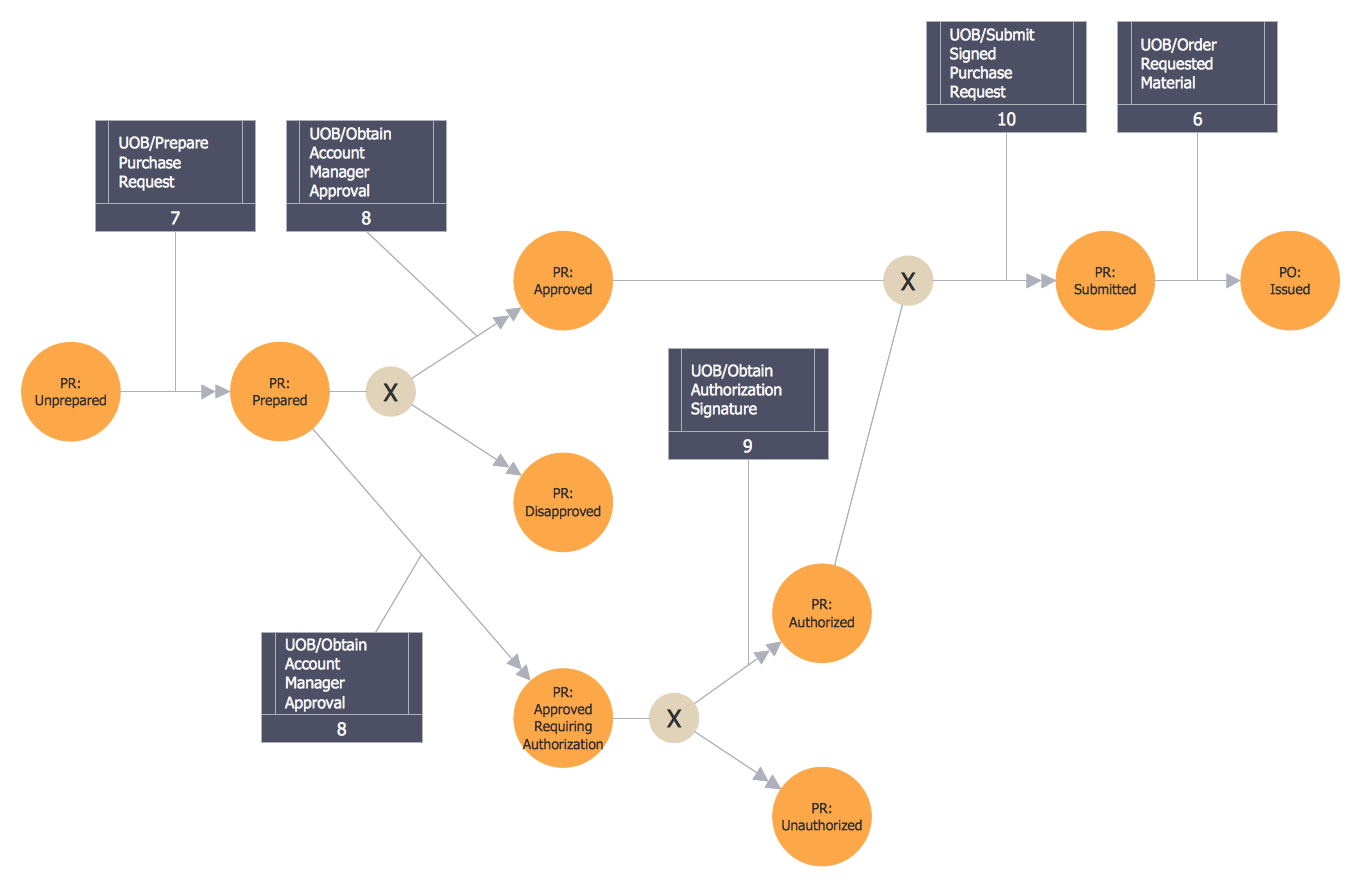
Example 1. HR Management Process Flow Chart
Benefits of Process Flow Chart
The Process Flow Chart has a wide set of benefits:
- gives a clear documentation of a process;
- allows to define and offers a common understanding of processes;
- helps to build a process visual representation for analysis, discussion, and communication;
- allows to identify the scope of the process;
- allows to trace and analyze the process steps;
- helps to standardize and find areas for monitoring, improvement, and increased efficiency in a process;
- allows to find and detach the steps of the process that are not essential;
- helps in understanding the logic of complex problems;
- offers guidance for managers overseeing operations;
- shows the plant design basis, the arrangement of major equipment, process lines, and main control loops;
- indicates feedstock, product, mainstream flow rates, and operating conditions;
- facilitates communication between programmers and business people;
- helps programmers to write programs of any complexity and in any high-level language;
- helps in the debugging process and provides efficient program maintenance;
- helps to understand and explain to other people the logic of the complex problems and their solution;
- assists in improving teamwork effectiveness.
Types of Process Flowcharts
There is an extensive variety of Process Flowcharts and diagrams which are usually used to give everyone a clear understanding of some process, helping to identify non-value-added operations, facilitating teamwork and communication, keeping everyone on the same page, designing the flows, etc. Many of them can be made using ConceptDraw DIAGRAM process flow diagram software. These include:
- Process Flow Diagram,
- Process and Instrumentation Drawing,
- TQM Diagram,
- EPC Diagram,
- Basic Flowchart,
- Cause and Effect Diagram,
- Cross-Functional Flowchart,
- Data Flow Diagram,
- Fault Tree Analysis Diagram,
- Audit Diagram,
- Sales Flowchart,
- Work Flow Diagram,
- Accounting Flowcharts,
- ER Diagram as well as many more others.
Importance of Process Flow Charts in Business
When trying to figure out the nature of the problems occurring within a project, there are many ways to develop such understanding. One of the most common ways to document processes for further improvement and business development is to draw a Process Flowchart, which depicts the activities of the process arranged in sequential order. This process is a part of business process management and helps in training and onboarding new employees.
Process flow charts help businesses streamline operations, reduce costs, improve productivity and decision-making, optimize processes and resource allocation, and achieve long-term success. They reduce misunderstandings and improve the clarity of complex processes and communication within business teams. Process flow charts assist in problem-solving and increasing efficiency through the identification of inefficiencies, bottlenecks, redundancies, delays, and areas for improvement. They help to ensure consistency and improve quality control. Standardizing processes through Process flow charts reduces errors and supports continuous improvement. As business evolves, Process flow chart is updated to reflect process changes, ensuring operations remain efficient and competitive.
ConceptDraw DIAGRAM is business process mapping software with an impressive range of productivity features for business process management and classic project management. This process diagram software is helpful for many purposes from different payment processes or manufacturing processes to chemical processes.
Business process mapping flowcharts help to clarify the actual workflow of different people engaged in the same process. ConceptDraw DIAGRAM business process mapping software for flowcharting is used as a classic Visio alternative for Mac and Windows. This sort of software is called the business process management tool.

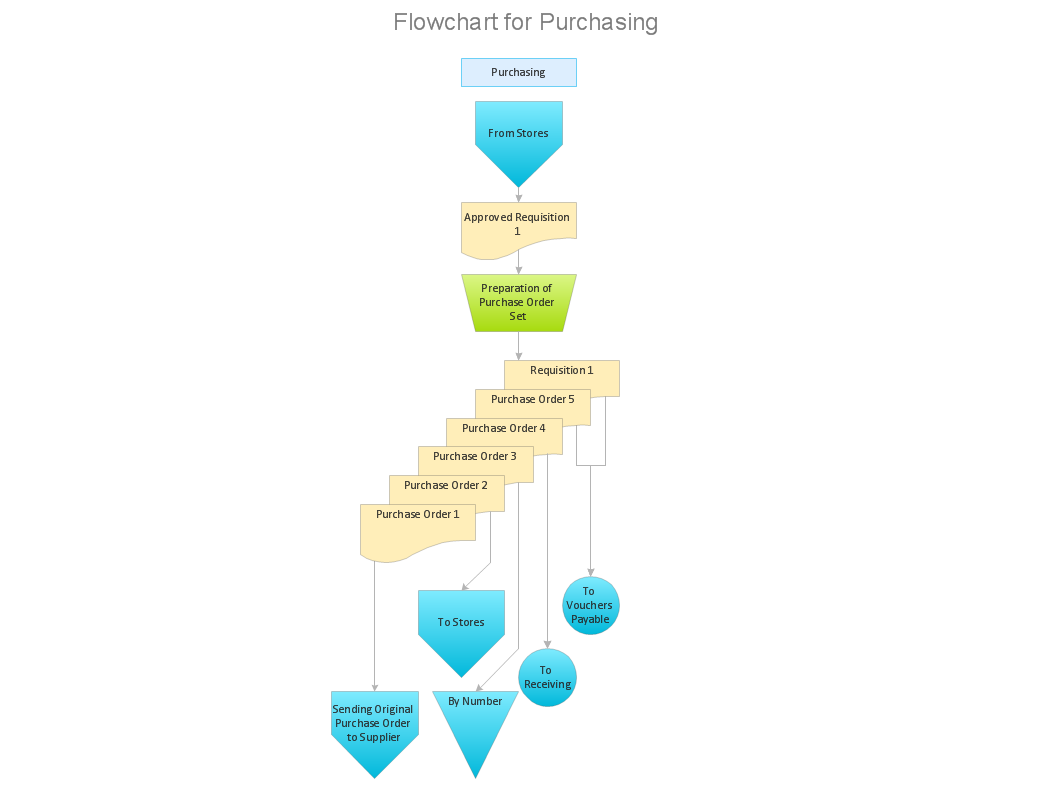
Example 2. Basic Flowchart Template
Create Process Flow Chart in ConceptDraw DIAGRAM
ConceptDraw DIAGRAM process flow software with Flowcharts Solution is the easiest way to create Process Flow Chart, Flow Process Chart, Flow Chart Process Map, or even High Level Process Flow Diagram. We propose to start with a Basic Flowchart template available from ConceptDraw STORE. Another way is to start with one of the samples included in the Flowcharts solution, choose one that closely resembles your project or create a new document and work in it.
Filling a template, changing a ready sample, or designing a Process Flow Chart in a new document, use the predesigned vector objects offered in Flowchart and Flowcharts Rapid Draw libraries of Flowcharts solution. Each of the offered objects is ready-to-use, simply drag it from the library to your document and use it according to your needs. In addition, each object is vector, so you can easily resize it without loss of quality and change its color style.
Whether you need to make Process flow diagram for a single unit or multiple units (which do not include detailed information and are known as the Schematic flow diagrams or Block flow diagrams) you can draw it in ConceptDraw DIAGRAM with help of already existing examples. Process flowcharts are usually used to display the relations between the main parts of the same system. Create Process flow diagram or your own flow model that analyses and illustrates all of the activities happening during your product or service making!
A variety of professional flowchart symbols, smart connectors, drawing tools, and shape libraries are available for your use to create Flowcharts of complex processes, procedures, and information exchange. Define, sort and document basic work and data flows, quality, financial, production management processes making different kinds of Flowcharts, Process flow models, Data flow or SDL diagrams in a perfect business tool ConceptDraw DIAGRAM. Increase efficiency and productivity of your business easily and reliably!

Example 3. Process Flow Chart. Design Elements — Product Life Cycle for MacOS and Windows
The Flow Process Charts you see on this page were created in ConceptDraw DIAGRAM software using the tools of Flowcharts solution. These samples are available for viewing and editing from ConceptDraw STORE. Use the Flowcharts solution for ConceptDraw Solution Park for fast and easy designing professional-looking Process Flow Chart of any degree of complexity.
Conclusion
The ConceptDraw DIAGRAM software makes the process of creating Flowcharts of any type, including the Process Flow Charts, well-organized and clear for developers and customers. It is possible due to the Flowcharts solution from ConceptDraw Solution Park, its predesigned vector objects, templates, and a lot of professional-looking practical samples and examples which can be quickly and easily modified, saved to a variety of formats such as PDF file, MS PowerPoint, MS Visio, and many other graphic formats, as well as printed or published on web.