Find out what amount and type of
equipment is needed for your office network
Wireless computer network diagrams help system administrators and network engineers to find out amount and type of equipment needed for each office WLAN.
Wireless Networks solution from ConceptDraw Solution Park extends ConceptDraw DIAGRAM diagramming software to help network engineers and designers efficiently design, create and illustrate wireless network diagrams. The solution contains a comprehensive library of objects for drawing different types of wireless network diagrams.
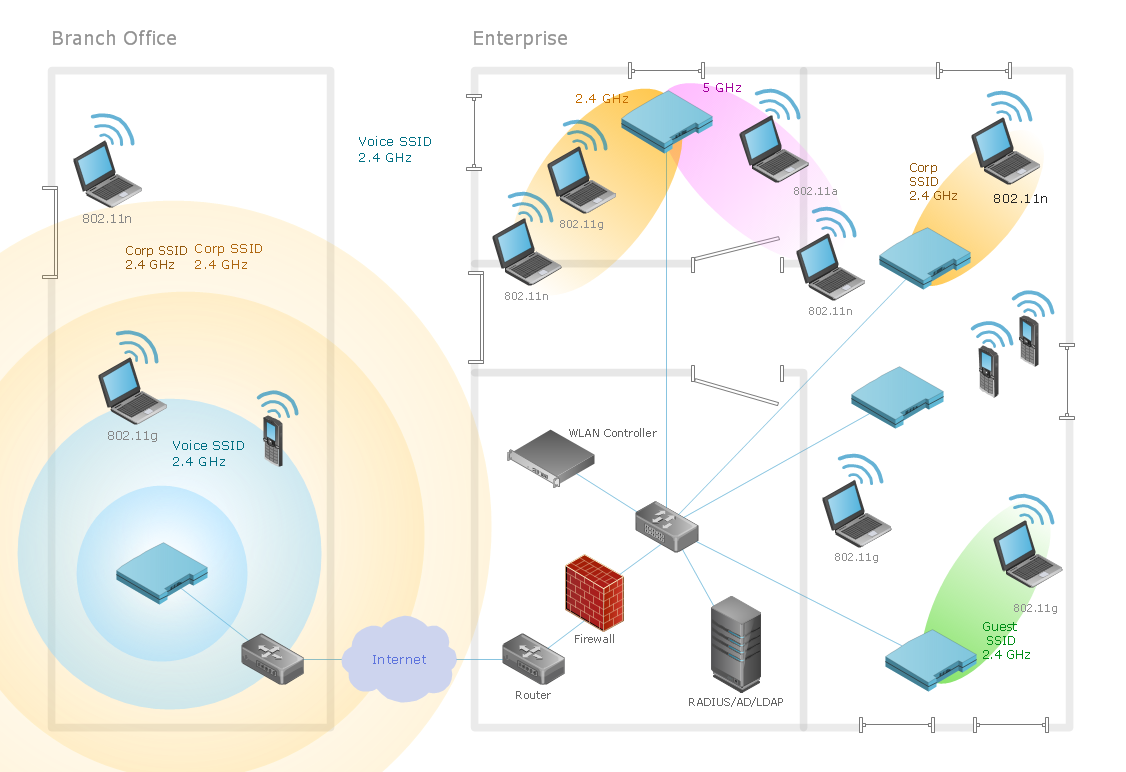
Sample 1. Wireless network diagram: Ultra high performance WLANs.
This diagram was created in ConceptDraw DIAGRAM using the Wireless Network library from the Wireless Networks solution.
When planning a WLAN for a complex office environment, it is important to be able to clearly display the interactions between all devices. This template shows the relationships between devices and their technical capabilities.
TEN RELATED HOW TO's:
Why do you need network visualizations? 🔸 Unlock the full potential of network visualization with our in-depth guide on using the ConceptDraw Network Visualization Tool. ✔️ Explore features, tips, and best practices to create stunning visual representations of your network architecture
Picture:
Network Visualization Guide.
How to Use ConceptDraw Network Visualization Tool
Related Solutions:
A Process Flow Diagram (PFD) is a diagram which shows the relationships between the main components in a system. Process Flow Diagrams are widely used by engineers in chemical and process engineering, they allows to indicate the general flow of plant process streams and equipment, helps to design the petroleum refineries, petrochemical and chemical plants, natural gas processing plants, and many other industrial facilities.
ConceptDraw DIAGRAM diagramming and vector drawing software extended with powerful tools of Flowcharts Solution from the Diagrams Area of ConceptDraw Solution Park is effective for drawing: Process Flow Diagram, Flow Process Diagram, Business Process Flow Diagrams.
Picture: Process Flow Diagram
Related Solution:
The Venn diagram example below shows sustainable development at the confluence of three constituent parts.
Create your Venn diagrams for problem solving in environmental social science using the ConceptDraw DIAGRAM software.
Picture:
Venn Diagram Examples for Problem Solving
Environmental Social Science
Human Sustainability Confluence
Related Solution:
How To Make a Floor Plan? Usually drawing of Floor Plans is quite complex and time-taking process. But now thanks to the ConceptDraw DIAGRAM diagramming and vector drawing software extended with Floor Plans Solution from the Building Plans area of ConceptDraw Solution Park this process became quick and simple.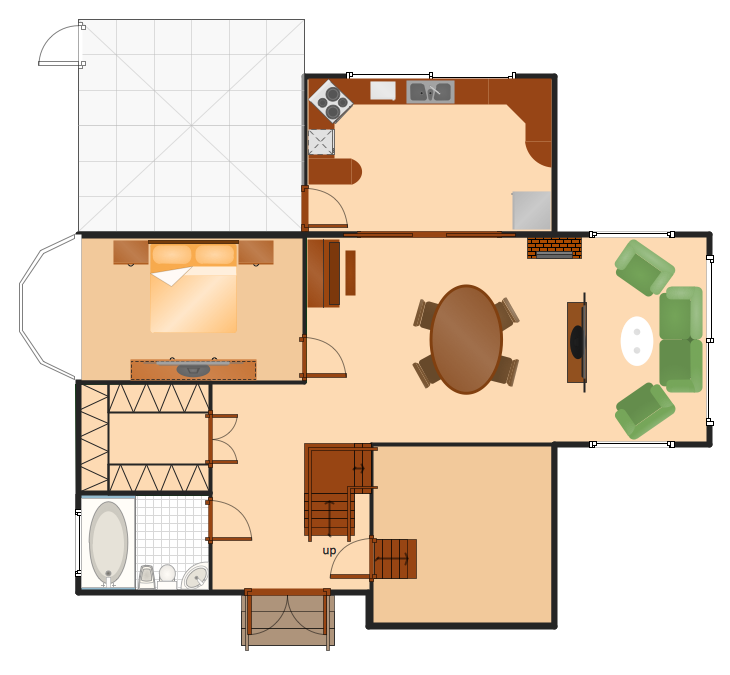
Picture: How To Make a Floor Plan
Related Solution:
It is very difficult to get into database model idea without any examples. To create one, you can use Chen’s notation for Entity Relationship Diagrams (ERD) and try to see all the peculiarities yourself. This notation describes entities and relations as basic geometric shapes like rectangles and diamonds.
Chen notation for Entity-relationship diagrams is used for designing relational databases. It depicts the database entities as a set of subjects. For example events, people, ideas, etc. All entities has common characteristics (attributes). Any object of the system is identified as the sole and unique. The name of entity should indicate the class or type of the the whole object, not a given example. The connection commonly represents a relationship between entities. Conceptdraw Entity-Relationship Diagrams (ERD) solution provides the libraries with ready-to-use ERD element fitting Chen's notation objects and relationships.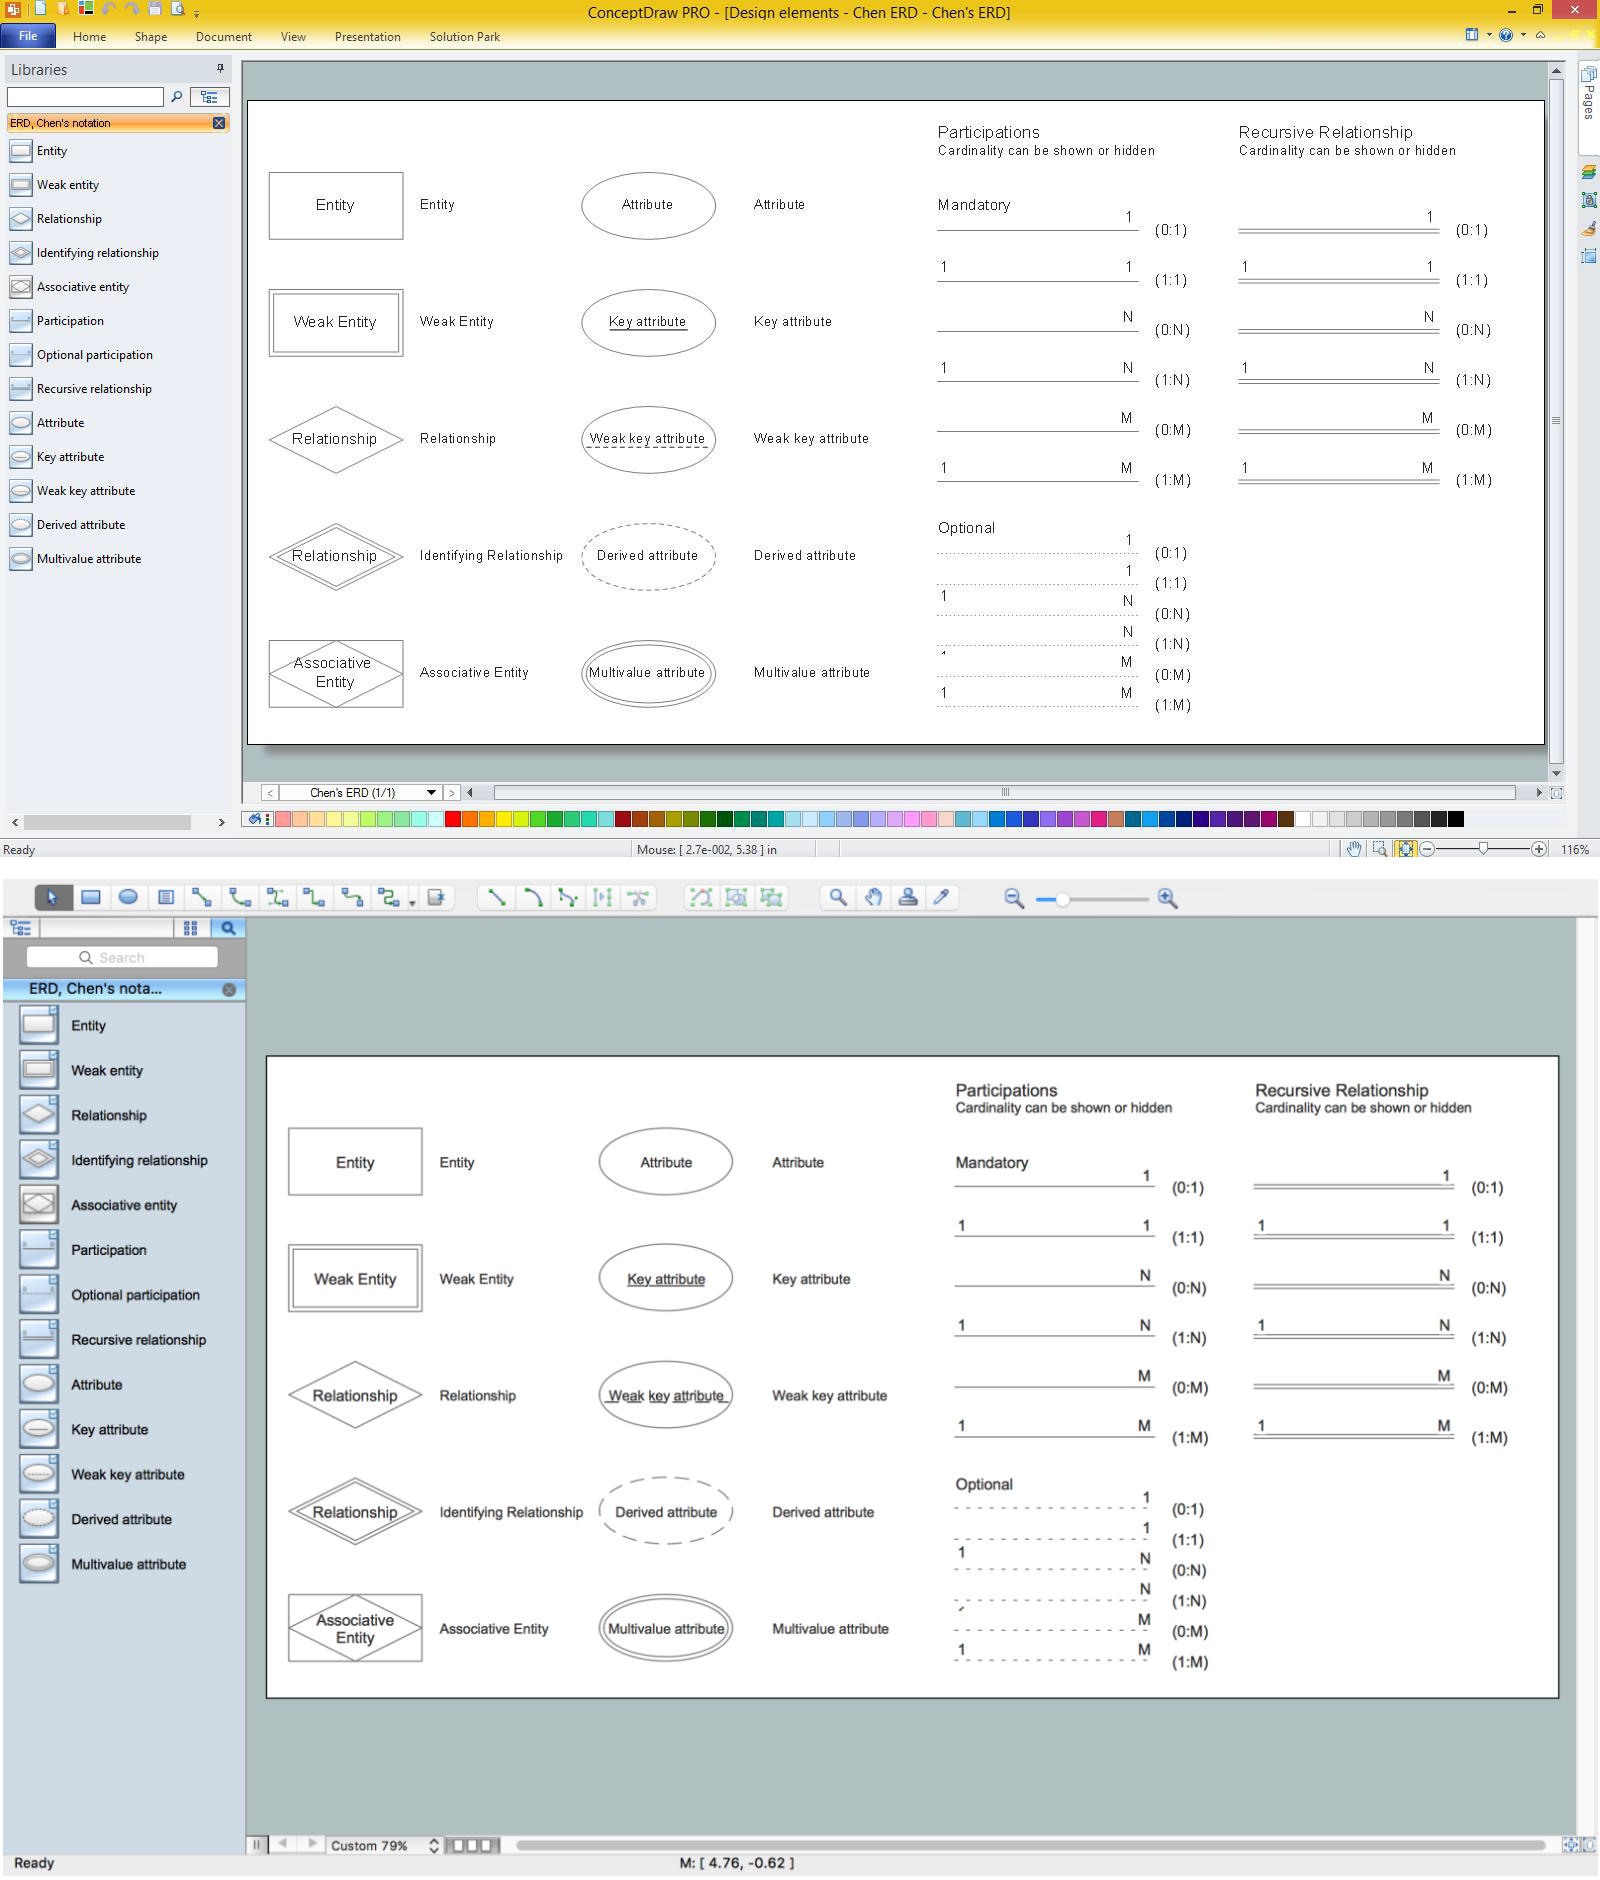
Picture: Design Element: Chen for Entity Relationship Diagram - ERD
Related Solution:
Studying informatics demands knowledge in the area of computer networks as well. The most famous world network, Internet, is an example of wide area network (WAN) topology that connects devices spread on any distance. Unlike other smaller networks that are limited to a building or to a campus, WAN is almost limitless.
This WAN (wide area network) diagram was created in ConceptDraw DIAGRAM. It shows a telecommunication network that covers a large geographical area connecting several settlements. This type of networks is commonly used by business and government institutions. Using the WANs enables them quickly communicate information between remote geographical points. To reproduce this network diagram, you will need the means, provided by ConceptDraw Computer and Network Diagrams solution.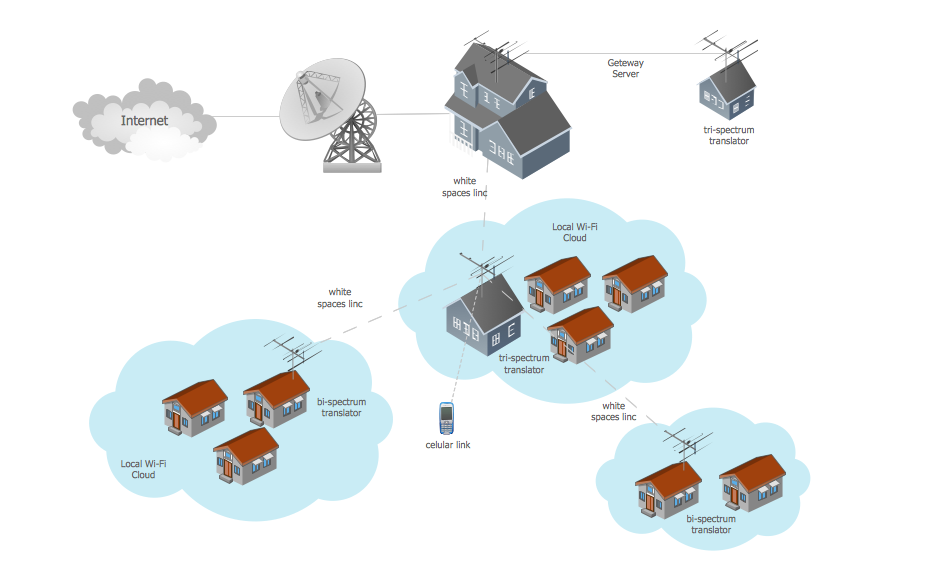
Picture: Wide area network (WAN) topology. Computer and Network Examples
Related Solution:
Identify what factors are causes and which factors are effects.
Factors that are causes are called Drivers; a consequence of factors is called Indicators.
Indicators help establish KPI (Key Performance Indicators) to monitor changes and the effectiveness of corrective actions in resolving a problem.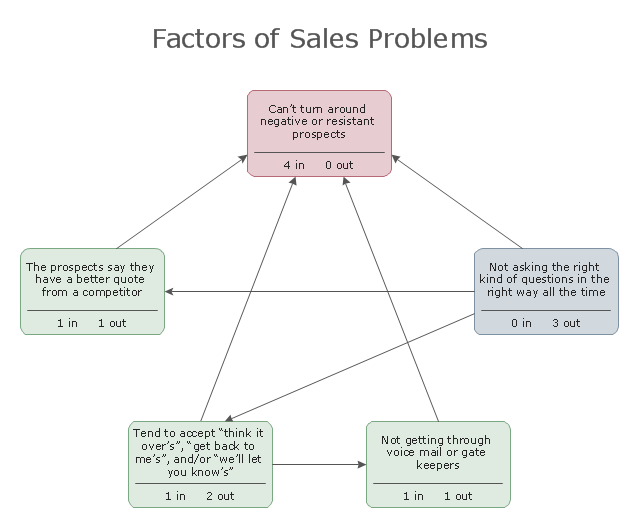
Picture: Relations Diagram
Related Solution:
ConceptDraw MINDMAP with the ability to import presentations from Microsoft PowerPoint, as well as enhancing its existing presentation capabilities.
Picture: Best Mind Mapping Program for Making Presentations
Related Solution:
The reliability is a cornerstone for any corporate computer network. If you want to provide a high fault tolerance, a mesh network topology would be the solution. The main advantage of this network is that every node can work as a commutator, although it’s not easy to set up this kind of network.
A mesh network topology may be full, or partial. Full mesh network means that each node of the network (computer, workstation or other equipment) is connected directly to each of the other nodes. A partial mesh topology means that a part of nodes are connected with a whole network, and the other part of nodes are only connected to those equipment, they exchange the majority of data. This illustration shows schematic diagram of a partial mesh network containing six nodes. Each node is represented as a circles and connections are drawn as straight lines. The connections may be both wired and wireless. This scheme can be used to make the specific logical or physical network diagrams by means the ConceptDraw Computer and Networks solution.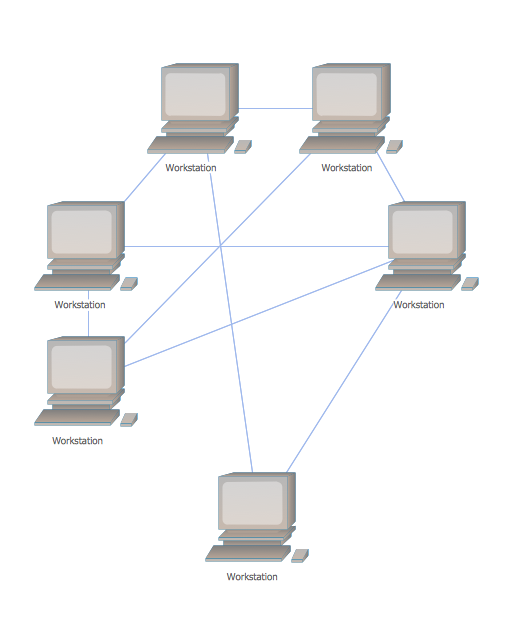
Picture: Mesh Network Topology Diagram
Related Solution:
A Venn diagram, sometimes referred to as a set diagram, is a diagramming style used to show all the possible logical relations between a finite amount of sets. Having ConceptDraw DIAGRAM software one allows anyone who cares for their drawings to look not only nice but also smart and professional.
Picture:
Venn Diagram Examples for Problem Solving
Computer Science. Chomsky Hierarchy
Related Solution: