8 Step Problem Solving
QualityIn Solutions from Quality Management Area we support quality and manufacturing managers with visualization tools for production quality control and improvement. The solutions from Quality Management Area extend ConceptDraw DIAGRAM software with Quality Diagrams. Quality mind mapsThis solution extends ConceptDraw MINDMAP software with Quality Management Mind Maps (Presentations, Meeting Agendas, Problem to be solved). |
This mind map shows 8 steps approach to solving any kind of product or service problems.

Example 1. 8 Step Problem Solving
Export to Outline
8 Step Problem Solving
-
Clarify the problem
- make sure you clearly state the problem and state how it ties to your unit mission
-
Breakdown the problem
- identify performance gap; what is the current performance compared to desired performance
-
Set a target
- what level of performance is desired and by when
-
Analyze the root cause
- get to the level of cause that will ensure the problem does not recur
-
Develop countermeasures
- identify what specific actions need to be taken to counter the root cause of the problem
-
See countermeasures through
- follow-up and verify countermeasures are being applied.
-
Evaluate both results and process
- make sure the countermeasures are providing the results predicted and desired
-
Standardize successful processes
- share your successes with functionals, make the changes permanent.
The Benefits for ConceptDraw MINDMAP Brainstorming Software
- ConceptDraw MINDMAP is effective for brainstorming, designing mind maps, idea generating, creative and lateral thinking, creativity and problem solving.
- ConceptDraw MINDMAP is ideal for team and personal work in Business, Marketing and Project Management.
- The libraries with large quantity of vector objects help to illustrate your mind maps and to make them bright, visual and comprehensible.
- Use of View Navigator tool lets create presentations from a mind map: you can simply select the map parts you want to present, sequence your slides, and preview the presentation.
- ConceptDraw MINDMAP provides wide capabilities of importing and exporting in various formats: Microsoft PowerPoint, Microsoft Word, MS Excel, Mindjet MindManager, image, HTML, PDF file.
NINE RELATED HOW TO's:
Cause and Effect Analysis - The Seven Management and Planning Tools is a tool for Cause and Effect Analysis that allows users to analyze the root causes for factors that influenced the problem. This diagram is constructed separately for each highly prioritized factor. The Diagram is then used for further formulation of potential actions.
Picture: Cause and Effect Analysis
The Affinity Diagram shows the structure of large, complex factors that have an influence on a problem, and then divides them up into a smaller and simpler structure. The Affinity Diagram does not show a causal relationship between the factors. This diagram is designed to prepare the data for further analysis of the cause-effect relationships.
Picture: Affinity Diagram
Related Solution:
The affinity diagram is a business tool used to organize ideas and data. It is one of the Seven Management and Planning Tools. But how design the Affinity Diagram quick and easy? ConceptDraw DIAGRAM diagramming and vector drawing software offers the Seven Management and Planning Tools Solution from the Management Area.
Picture: Affinity Diagram
Related Solution:
A causal model is an abstract concept, that describes the causal mechanisms of a system, by noting certain variables and their influence on each other, in an effort to discover the cause of a certain problem or flaw. This model is presented in diagram form by using a fishbone diagram.
ConceptDraw DIAGRAM diagramming and vector drawing software enhanced with Fishbone Diagrams solution helps you create business productivity diagrams from Fishbone diagram templates and examples, that provide to start using of the graphic method for the analysis of problem causes. Each predesigned Fishbone Diagram template is ready to use and useful for instantly drawing your own Fishbone Diagram.
Picture: Fishbone Diagram Template
Related Solution:
With this mind map template, you can quickly prepare for quality meetings by filling in the appropriate fields. By using this mind map to take notes during the meeting, you'll be able to send a one-page summary to meeting participants or use later to present the material, yourself, to a different audience.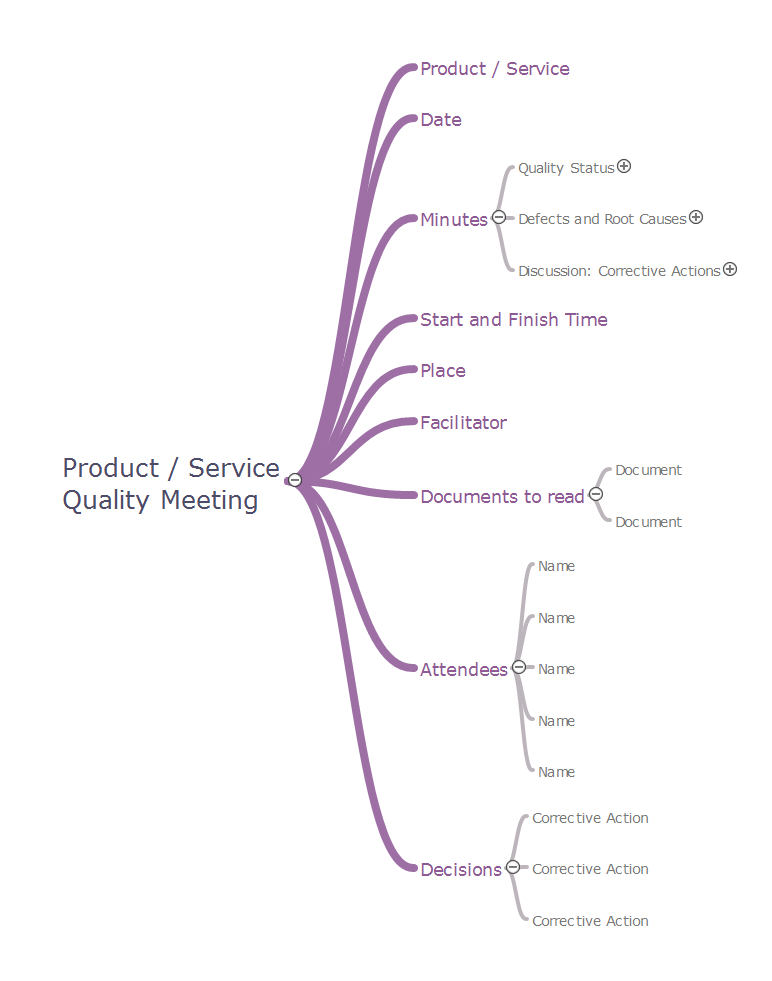
Picture: Quality meeting
Related Solution:
If you have your own business, you shouldn’t be afraid to use different management techniques. It also should be mentioned that SWOT analysis tool for small business is just as useful as for an transatlantic corporation. If you want to see whether you company is able to compete on the market, SWOT analysis is a great solution.
The following drawing illustrates the simple template, created for providing SWOT analysis. You can use it for your management courses as a tutorial for SWOT analysis. The tips, added to each section of a matrix are intended to help you to fill them with the information of the strengths and weaknesses of your training case, and do not forget, at the same time, about opportunities and threats. This template is one of a set of templates of SWOT matrices that can be found in the the ConceptDraw SWOT and TOWS diagrams solution. This solution used as part of simple project management software in ConceptDraw Office as advertising agency software or marketing management software.
Picture: SWOT Analysis Tool for Small Business
ConceptDraw DIAGRAM software extended with Fishbone Diagrams solution from the Management area of ConceptDraw Solution Park is perfect for Cause and Effect Diagram creating. It gives the ability to draw fishbone diagram that identifies many possible causes for an effect or a problem. Causes and Effects are usually grouped into major categories to identify these sources of variation. Causes and Effects in the diagram show relationships among various factor. Fishbone diagram shows factors of Equipment, Process, People, Materials, Environment and Management, all affecting the overall problem.
Picture: Cause and Effect Diagram
Related Solution:
The Workflow diagrams are the specialized type of flowcharts which allow to visualize any sorts of step-by-step processes. They are usually created as flowcharts, with objects that represent in a simple visual manner the steps in the process connected by arrows that indicate the next step. The ability easily create Workflow diagrams visually describing the tasks, documents associated with the tasks, people which are responsible for execution at each stage of workflow is made possible with Workflow Diagrams solution. This solution extends ConceptDraw DIAGRAM with a Workflow Diagram library that contains large collection of predesigned workflow flowchart symbols.
Picture: Workflow Flowchart Symbols
Related Solution:
ConceptDraw Pyramid Diagram software allows drawing column charts using predesigned objects or drawing tool.
Picture: Fundraising Pyramid
Related Solutions:
ConceptDraw
MINDMAP 16