How to Draw a Flowchart: Step-by-Step Guide
Are you confused about how to draw a flow chart? Here are some guidelines, which can be used to ease the process of understanding the system and its flow.
Most of us don't know how to deal with flow charts when we are novice users but with the passage of time and experience we gain expertise. A good flow chart helps to understand the systematic flow of information in the system. If a flow chart is not created properly then it may mislead the designer of the system or may result in fatigue consequences. Therefore, it is very important that you make a flow diagram with caution and expertise. I would always suggest you to use a flow chart to ease the process of understanding the system and its flow.
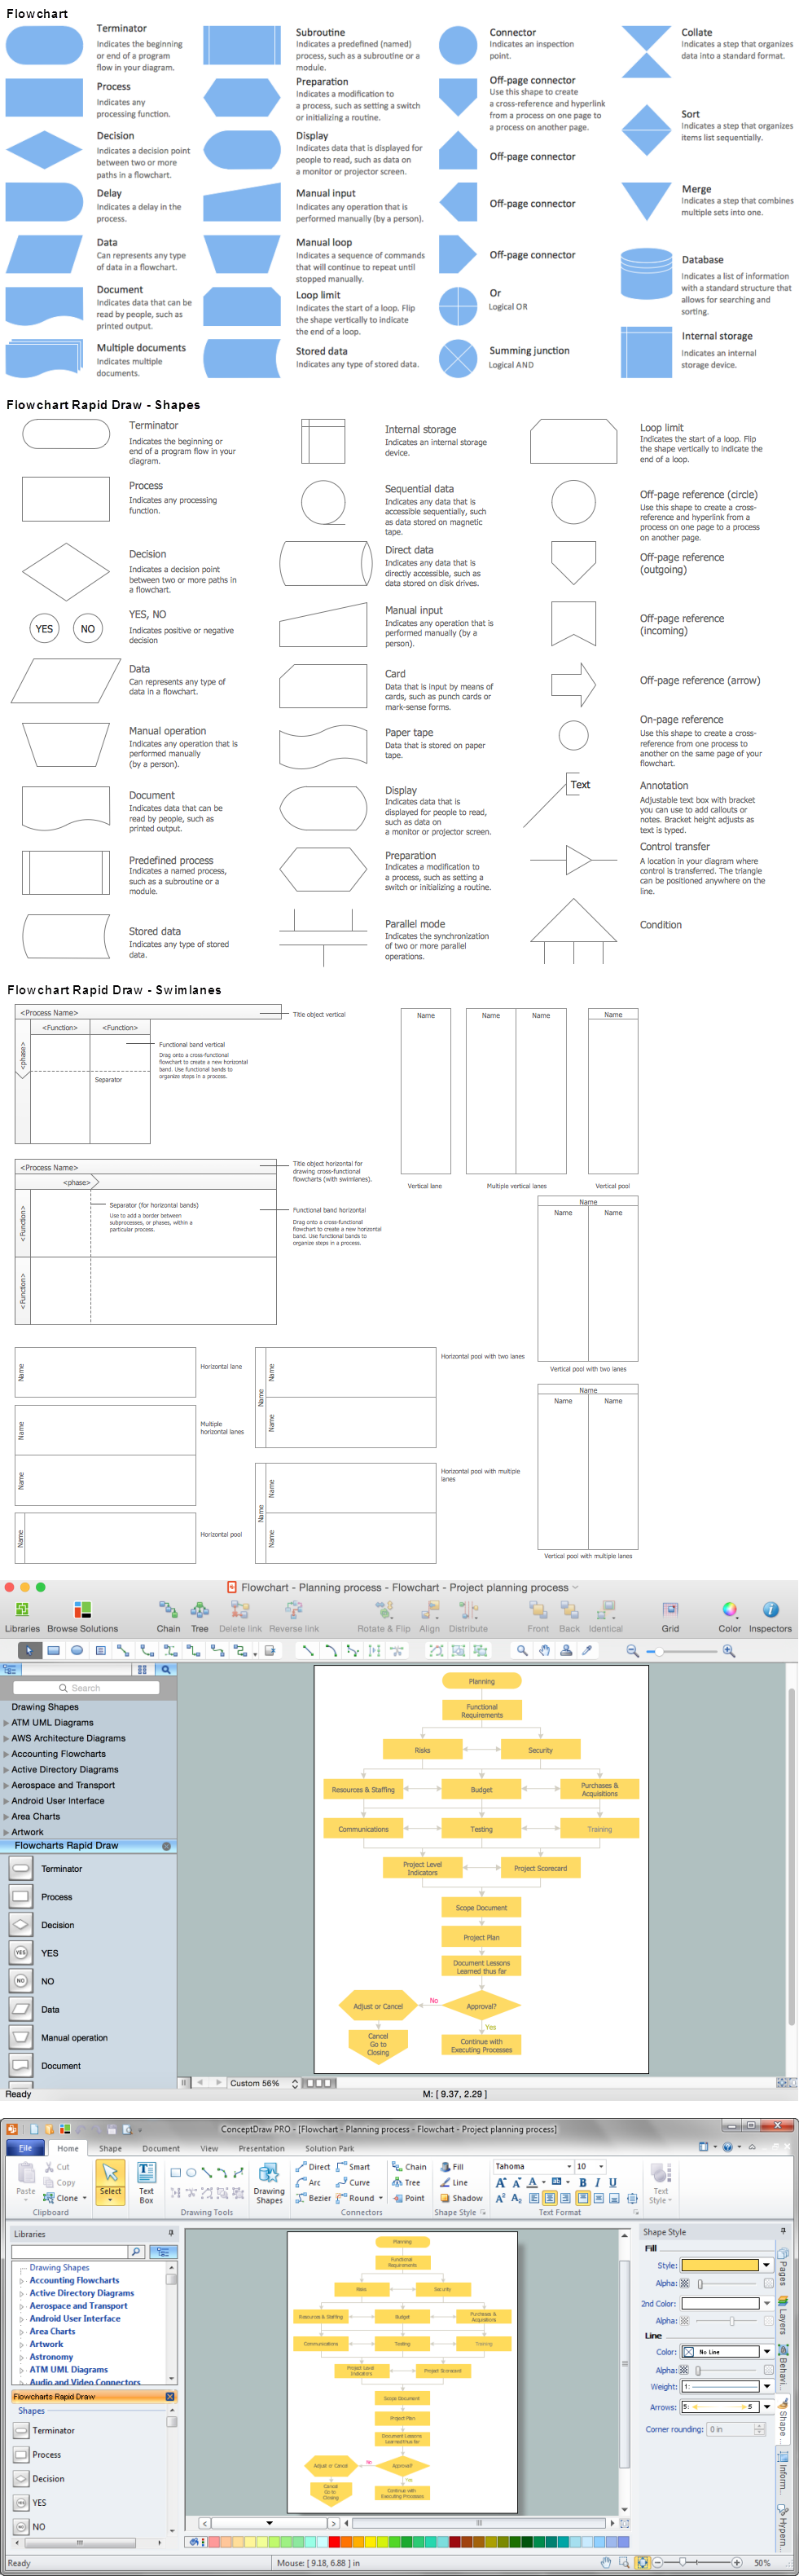
Key Flowcharting Symbols
Although there are many symbols that can be used in Flowcharts to represent different kinds of steps, accurate Flowcharts can be created using very few (e.g. Process, Decision, Start, delay, cloud).
The basic element of a Flowchart is a simple action, which can be anything from striking an anvil to making a cash payment, and is represented as a box containing a description of the action. The mapping of 'what follows what' is shown with arrows between sequential action boxes, as in the illustration. This also shows the boxes for Flowchart start and end points of which there are normally one each.

Fig. 1. Basic Flowchart Elements
Processes become more complex when decisions must be made on which, out of an alternative set of actions, must be taken. The decision is shown in a Flowchart as a diamond-shaped box containing a simple question to which the answer is 'yes' or 'no' as in Fig. 2. More complex decisions are made up of combinations of simple decision boxes.
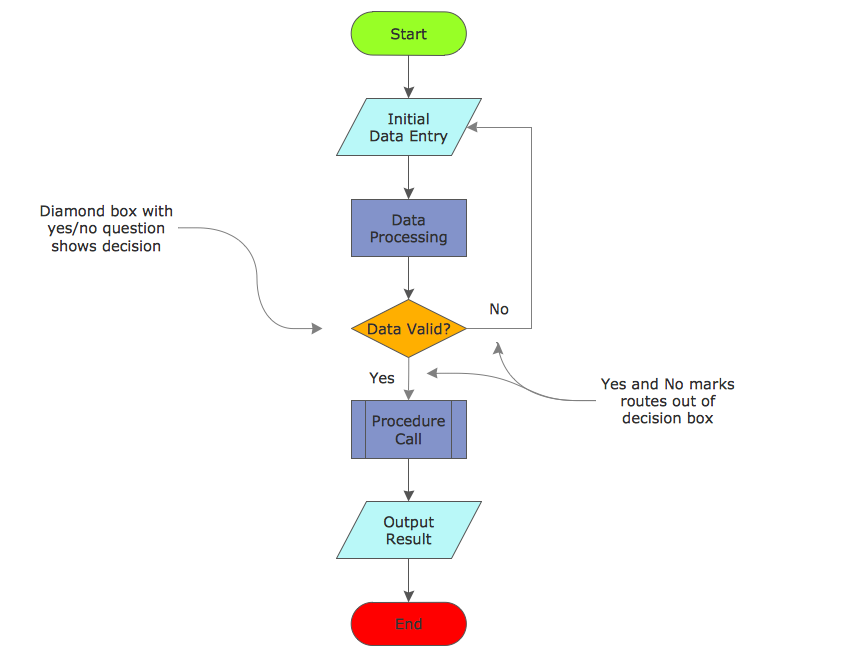
Fig. 2. Decisions in Flowcharts
Processes often go wrong around decisions, as either the wrong question is being asked or the wrong answer is being given.
Where boxes cannot be directly connected with lines, the separated lines are coordinated with connector boxes containing matching names. This typically occurs where lines cross onto another page, as in the illustration.
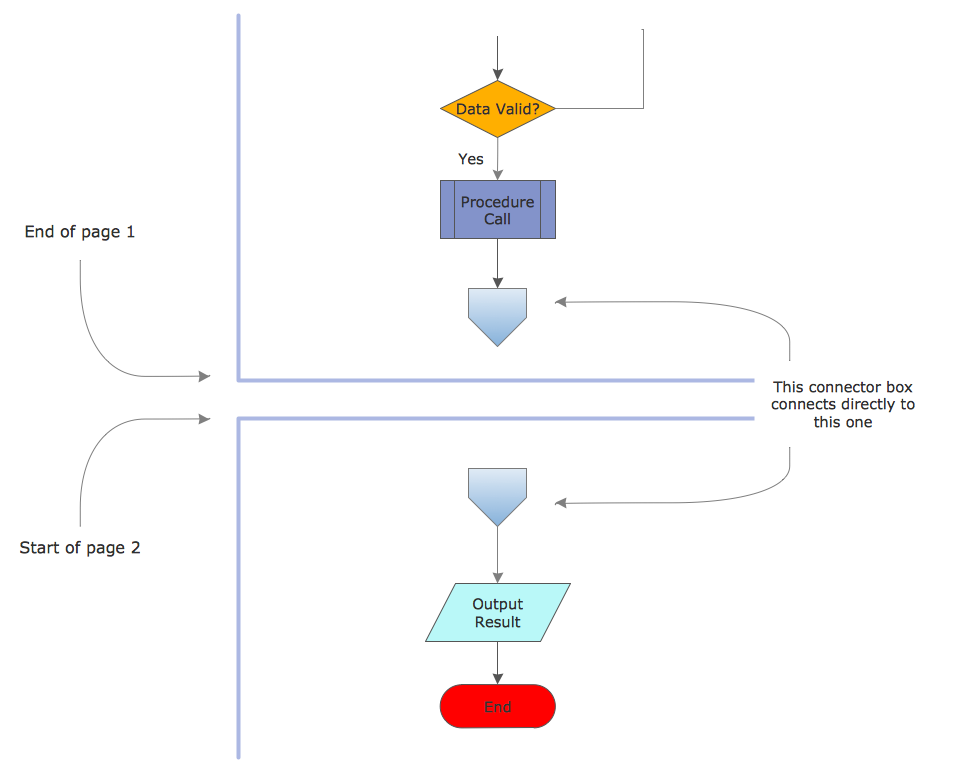
Fig. 3. Continuing Flowcharts Across Pages
By using multiple connector boxes, it is very easy for Flowcharts to become very large, although this is usually self-defeating, as the Flowchart then becomes difficult to understand. The ideal size for a Flowchart is one page, as this gives a single visual 'chunk' that is reasonably easy to understand as a single item.
Large processes can be broken down into a hierarchical set of smaller Flowcharts by representing a lower-level process as a single sub-process box. This behaves like a normal action box at the higher level, but can be 'zoomed into' to expose another Flowchart, as in Fig. 4.
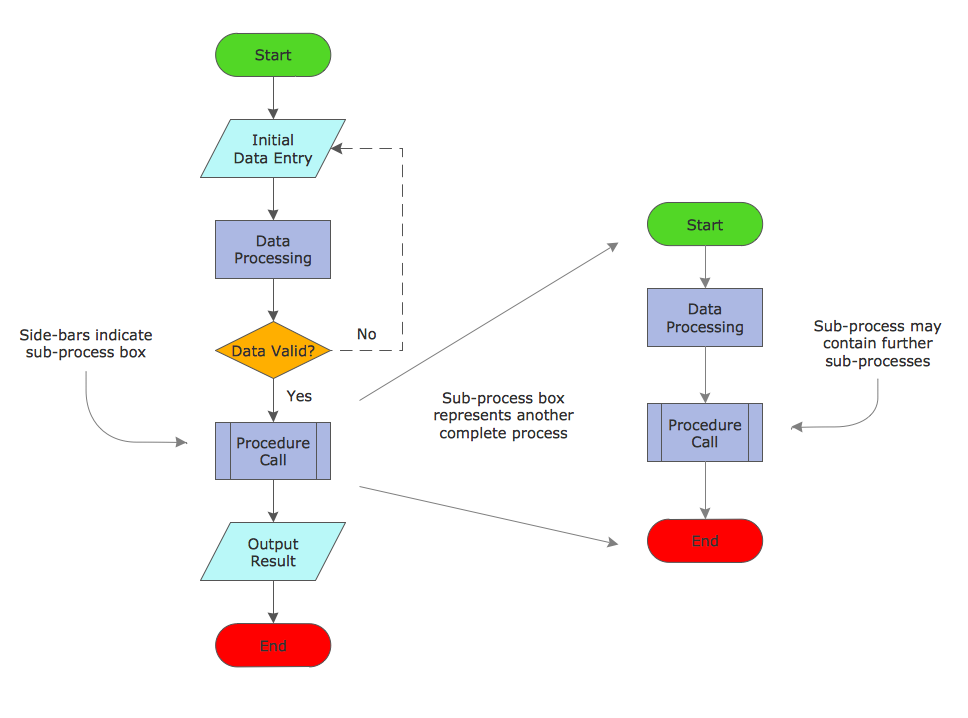
Fig. 4. Sub Processes
An additional 'action' box that can be useful when analyzing processes is the wait box, which highlights a delay (i.e. no action), as in the illustration. This is a typical point where the overall cost of a process may be improved by acting, possibly on other processes, to reduce the delay.

Fig. 5. Delay Flowchart Symbol
How to Create Flowchart Using Standard Flowchart Symbols
Flowcharts are helpful in understanding a complicated process. ConceptDraw DIAGRAM software is the easiest way to make Flowchart. It allows you to create flow diagrams professionally, quickly, and easily.
- Open a ConceptDraw DIAGRAM new document and select the Flowchart library from the Flowcharts solution.
- Add the proper Flowchart elements to the diagram by dragging them from the library to the document page.
- The Flowchart should be started and ended with the Terminator symbol.
- Use the Decision symbol to ask a question.
- The Process symbol is used for activities or action steps.
- A circle symbol containing a letter or number means that this chart connects to another chart on a different page.
- Connect the Flowchart elements with the arrow connectors using the button.
How to Draw an Effective Flowchart
Follow the simple steps to create an effective Flowchart fast and easily:
- Define the process boundaries with starting and ending points.
- Complete the big picture before filling in the details.
- Clearly define each step in the process. Be accurate and honest.
- Identify time lags and non-value-adding steps.
- Circulate the Flowchart to other people involved in the process to get their comments.
Flowcharts don't work if they're not accurate or if the team is too far removed from the process itself. Team members should be true participants in the process and feel free to describe what really happens.
Why Flowchart is Important?
A thorough Flowchart should provide a clear view of how a process works. With a completed Flowchart, you can:
- Identify time lags and non-value-adding steps.
- Identify responsibility for each step.
- Brainstorm for problems in the process.
- Determine major and minor inputs into the process with a cause & effect diagram.
- Choose the most likely trouble spots with the consensus builder.
Guidelines for Drawing a Flowchart
There are no hard and fast rules for constructing Flowcharts, but there are guidelines which are useful to bear in mind. Here are the steps which can be used as a guide for completing Flowcharts.
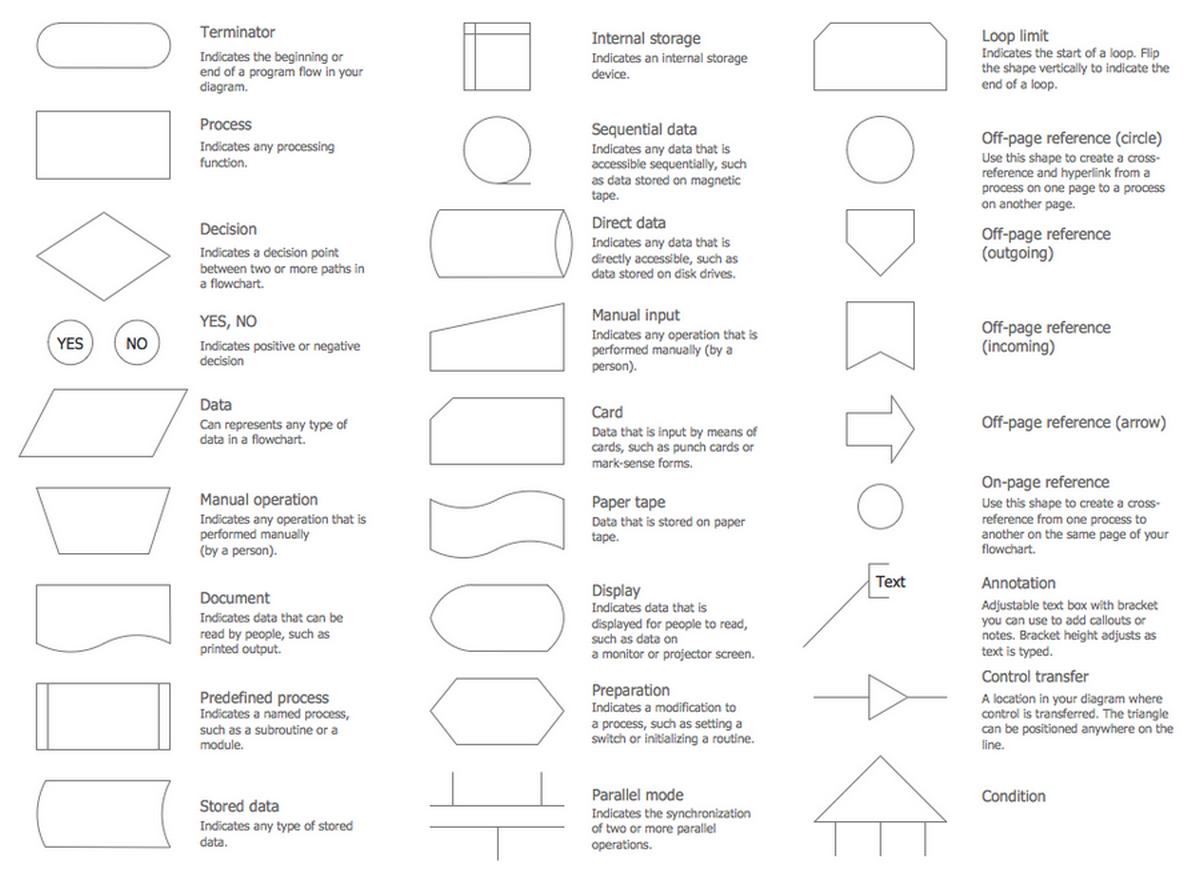
- Agree on a standard flowchart symbol set to use. Alternatively, a company standard may be available. It is important to agree a standard as there are several conflicting common uses.
- Draw a 'start' terminator box at the top of the work area.
- Add the first box below the start box, identifying the first action simply by asking, 'What happens first?'. Add an appropriate box around it.
- Add subsequent boxes below the previous box, identifying each action by asking, 'What happens next?'. Draw an arrow from the previous box to this one.
- Describe the process to be charted.
- Start with a 'trigger' event.
- Note each successive action concisely and clearly.
- Go with the main flow (put extra detail in other charts).
- Make cross references to supporting information.
- Gather the team who are to work on describing the process. These should include people who are intimately involved in all parts of the process, to ensure that it gets described as it actually happens, rather than an idealized view.
- Follow the process through to a useful conclusion (end at a 'target' point).
- If the final diagram is to be used as a part of a formal system, make sure that it is uniquely identified.
Essential Tools and ConceptDraw DIAGRAM Software for Drawing Flowcharts
With the flowchart drawing software, it's easier to draw a professional-looking Flowchart. You needn't take care of the drawing skill. Only understand the whole process flowchart. The flowchart software can help to quickly draw Flow diagram, Flowcharts, Workflow diagrams, NS diagrams, BPMN diagrams, Cross-functional flowcharts, Data flow diagrams, and Highlight flowcharts.

Example 1. How to Draw Flowchart in ConceptDraw DIAGRAM
Application of Flowcharts
ConceptDraw DIAGRAM app is the best program to make a Flowchart. Using the ready-to-use predesigned objects, samples, and templates from the Flowcharts solution you can create your own professional-looking Flowchart Diagrams quick and easy.
The Flowcharts are widely used in:
- business,
- software development,
- engineering,
- architecture,
- science,
- manufacturing,
- government,
- administration,
- etc.

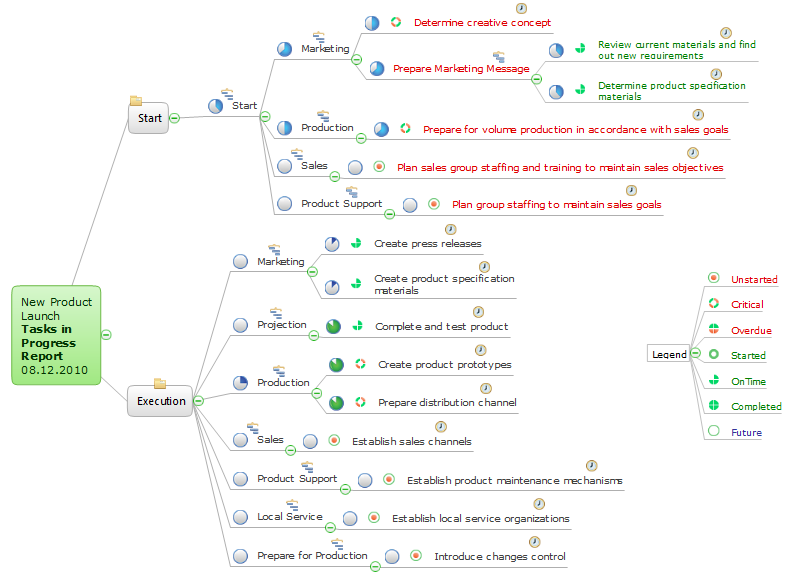
Example 2. Flow Chart Example. Template and Objects
The Flowcharts produced with ConceptDraw DIAGRAM flowchart application are vector graphic documents and are available for reviewing, modifying, and converting to a variety of formats (image, HTML, PDF file, MS PowerPoint Presentation, Adobe Flash, or MS Visio). The solution includes also a lot of ready-made examples of Flow Charts.