How To Draw an iPhone?
How to draw an iPhone? It's very fast and easy to draw an iPhone and design iPhone user interface using the tools of ConceptDraw DIAGRAM extended with iPhone User Interface Solution.
iPhone User Interface Solution from the Software Development Area offers you the incredibly large quantity of predesigned objects that are grouped to 9 libraries.
The iPhone 6 Mockup library contains ready-to-use mockups of iPhones. All that you need for drawing iPhone is simply drag the desired mockup from the iPhone 6 Mockup library, and then design the iPhone's interface using the objects from other libraries of iPhone User Interface Solution.
Another quick way of creating an iPhone illustration in ConceptDraw DIAGRAM is to use one of predesigned iPhone templates from ConceptDraw STORE and fill it.
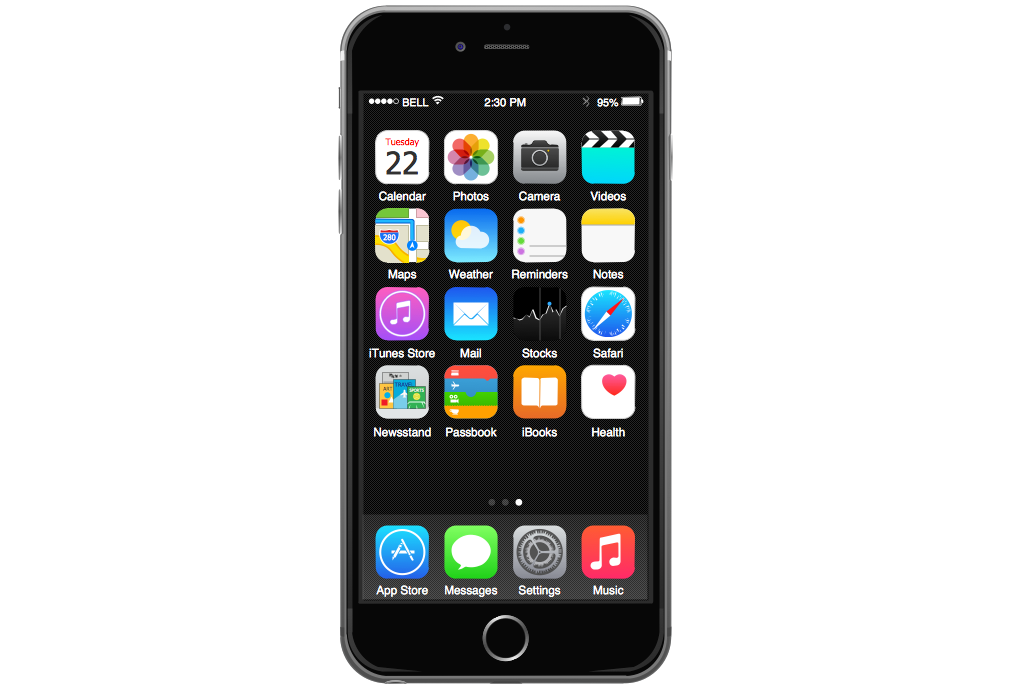
Example 1. How To Draw an iPhone
This template was created in ConceptDraw DIAGRAM using the objects from libraries of iPhone User Interface Solution and shows the iPhone Home Screen. You can see the variety of icons on the Home Screen that can be clicked for using the available applications. You can find this template in ConceptDraw STORE and use it for your needs.
Use the predesigned vector stencils, iPhone UI patterns, templates and samples from the iPhone User Interface Solution for ConceptDraw DIAGRAM to draw iPhone create your own iPhone interfaces quick and easy.
All iPhone interfaces designed with ConceptDraw DIAGRAM are vector graphic documents and are available for reviewing, modifying, and converting to a variety of formats (image, HTML, PDF file, MS PowerPoint Presentation, Adobe Flash or MS Visio).
TEN RELATED HOW TO's:
Data flow diagrams are the graphical tool, used in the visualization of data flow of some data processing systems. It is the valuable process modeling tool. Also designing DFD is the important component of the initial part of any information system development project. The standard symbols are used to represent the interaction of a system components and how various kinds of components influence on data flow. The ConceptDraw Data Flow Diagrams solution is design to assist professional software engineers in making DFDs according to Gane and Sarson, and Yourdon and Coad notations.
Do you imagine yourself as a successful IT specialist? To your mind, they all use data flow diagram examples to learn and to get inspired. Aren’t you still with us?
Picture: Data Flow Diagram Examples
Related Solution:
It’s very important that your soccer drawing looked beautiful, interesting and attracted the attention. For this it is necessary add the illustrations! The Soccer solution delivers several libraries with predesigned bright and interesting clipart objects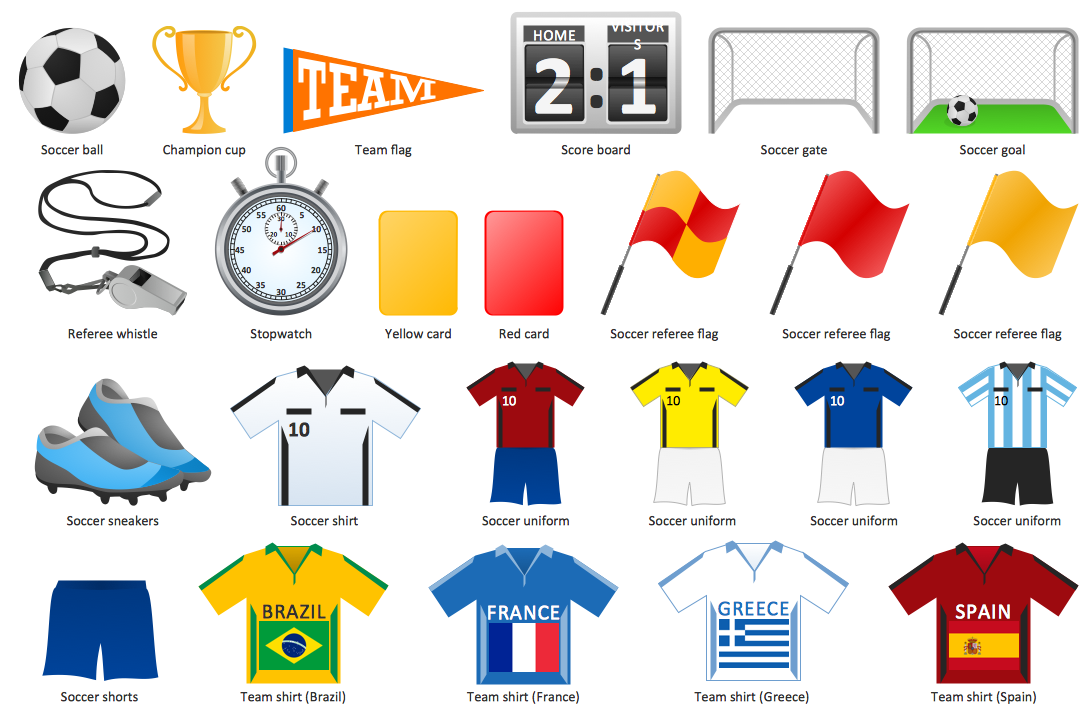
Picture: Soccer (Football) Illustrated
Related Solution:
ConceptDraw DIAGRAM diagramming and vector drawing software extended with Rack Diagrams solution from the Computer and Networks area is a powerful rack diagrams and server rack diagrams drawing software.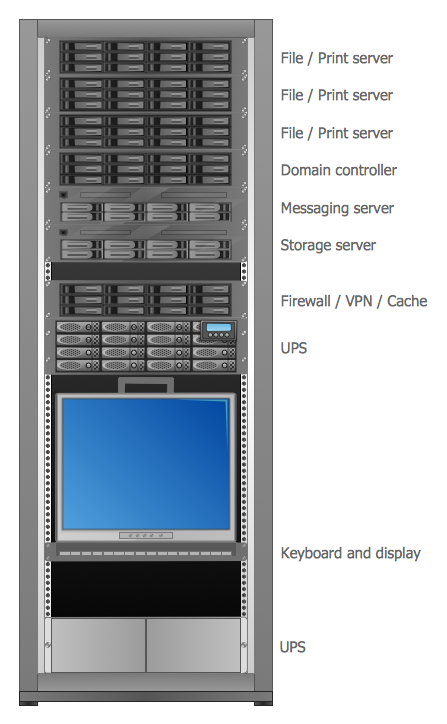
Picture: Server
Related Solution:
This sample shows the UML Class Diagram that was created in ConceptDraw DIAGRAM on the Mac and then was opened for editing in MS Visio.
Using the 13 libraries of the Rapid UML Solution for ConceptDraw DIAGRAM you can create your own visual vector UML diagrams quick and easy.
Picture: UML Diagram Visio
Related Solution:
Structured-systems analysis and design method uses data flow diagrams to represent the process of data flowing through a system. Talking about this might be useless without a proper example of DFD for online store (Data Flow Diagram). This DFD example shows all the distinctness that a diagram can bring into a scattered data structure.
Data flow diagrams are used to show how data is processed within some business processes. Making DFD is a common practice for business process modeling and analysis. This diagram represents the online store business flow. It describes inputs and outputs within online selling process and depicts the interactions between its participants. This DF diagram can be used by system analysts to create an overview of a business, to study and discover its inherent strengths and weak points.
Picture: Example of DFD for Online Store (Data Flow Diagram)
Related Solution:
All computer networks differ by various params, and their size is one of them. As global area networks are the biggest, personal area (PAN) networks are the smallest. Personal computers, smartphones and other devices that have possibility to connect to Internet form a personal network.
This diagram was created using ConceptDraw Computer Network Diagrams to represent a typical components of Personal area network. A personal area network (PAN) is the connection of IT devices around an individual person. This sample of personal area network involves a notebook, a personal digital assistant (PDA), and a portable printer. Commonly a PAN contains such wireless devices as mouse, keyboard, smartphone and tablet. A wireless connection is typical for a PAN.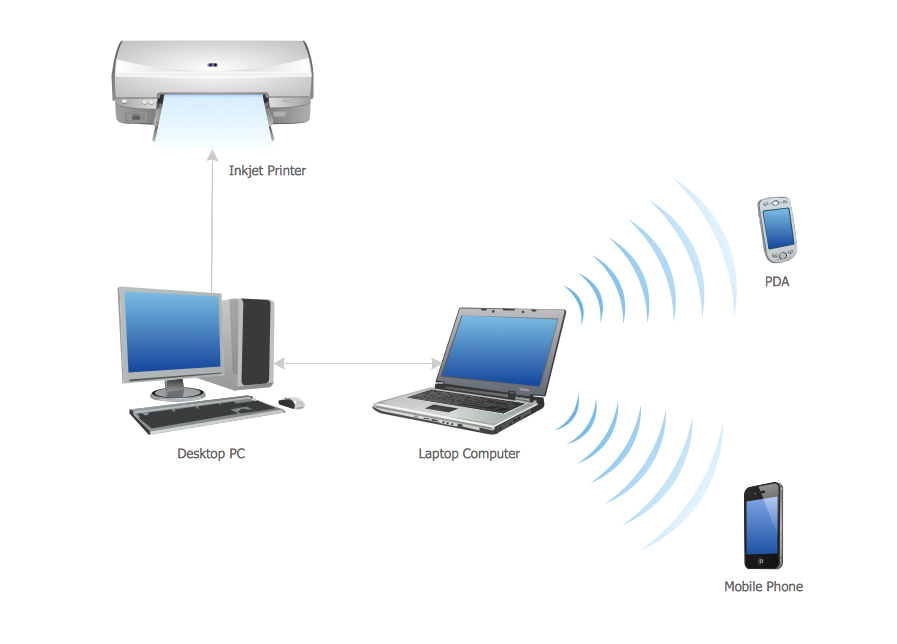
Picture: Personal area (PAN) networks. Computer and Network Examples
Related Solution:
Both Crow’s Foot and Chen’s notations are used to build database models. Each of them has its’ own features, and if you use a proper entity relationship diagram software, you’ll be able to create diagrams of any notation. Database model with clearly defined entities and relationships between them facilitates further work greatly.
This ERD represents the model of Employee Certification Entity. The entity-relationship diagram is a visual instrument of database software development. It is used to structure data and to define the relationships between structured data groups. This ERD was designed with a help of ConceptDraw Entity-Relationship Diagram (ERD) solution. The solution supports the both basic ERD notations used to describe the structure of database: Chen's and Crow’s Foot notations.
Picture: Entity Relationship Software
Related Solution:
This sample shows the Flowchart that displays the layout and work flow of the cloud marketing platform. This diagram has a style of the marketing brochure. This style displays the central product that is related to the other issues.
Using the ready-to-use predesigned objects, samples and templates from the Flowcharts Solution for ConceptDraw DIAGRAM you can create your own professional looking Flowchart Diagrams quick and easy.
Picture: Flowchart Marketing Process. Flowchart Examples
Related Solution:
The ConceptDraw DIAGRAM is a best flow chart tool for the job. The samples and templates included in the basic set allows users to draw any type of a flowchart. The vector stencils created by designers give ability to draw great-looking flowchart. Flowcharts give to users the ability to represent structural data visually.
Picture: Use the Best FlowChart Tool for the Job
Related Solution:


