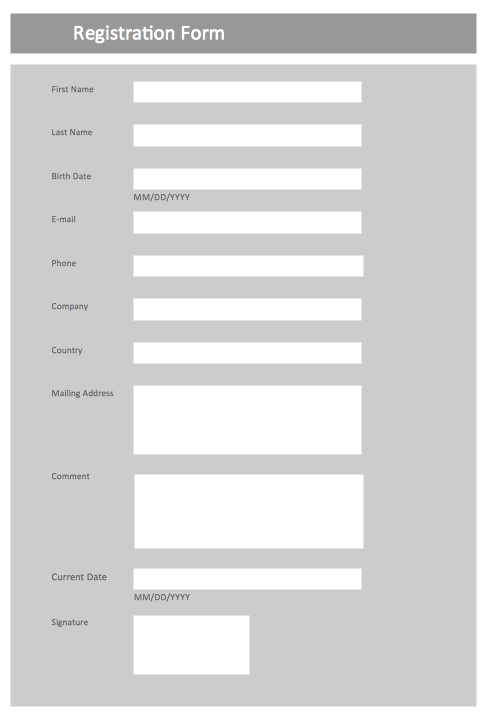
Sample 1. Registration form template.
This template was created in ConceptDraw DIAGRAM using the Basic Diagramming Solution and shows the registration form.
The documents designed with ConceptDraw DIAGRAM are vector graphic documents and are available for reviewing, modifying, and converting to a variety of formats (image, HTML, PDF file, MS PowerPoint Presentation, Adobe Flash or MS Visio).
TEN RELATED HOW TO's:
Creating a detailed network plan can cause a lot of headache to an unexperienced user. And it is worth mentioning that ConceptDraw DIAGRAM is a decent tool for creating a network diagram, a tool that is easy-to-use. To get an accurate diagram use the vector shapes from the special libraries that represent workstations, network appliances, wiring systems and connect them with smart-connectors, just as simple as that.
This communication network diagram displays the way different components of a computer network communicate with each other. When representing network information, such as depicting all the equipment in a large network, it is helpful to make visual representation. Network diagram provides an easy way to show the way the connections between an equipment in a large network. This diagram of a communication network depicts a network composed of three sub-networks. It uses a network equipment symbols to represent the different devices that make up a network communication including routers, Ethernet devices and end-point equipment.
Picture: ConceptDraw DIAGRAM Network Diagram Tool
Related Solution:
Local area network connects computers and other network appliances within an area, such as office building or a campus. It can be difficult to provide such network without a predesigned plan. For these purposes you can use network diagram software, which helps you to create LAN network diagrams and office network diagrams quickly and effortless. This will speed up your work and you can save the diagram for the future network improvements.
The following diagram illustrates a network topology of the small office. LAN configuration has a star topology. The local network joins 8 computers among which are several desktop PCs, laptop, two iMacs and iBook. The end-point devices are divided into three groups. Each group is connected to its hub. There is a network printer and a modem, which are interconnected with other devices through a network server. Each computer on the LAN can access the server through a corresponding hub.
Picture: Network Diagram Software. LAN Network Diagrams. Physical Office Network Diagrams
Related Solution:
Cisco icons are globally recognized and generally accepted as standard for network icon topologies. The ConceptDraw vector stencils library Cisco buildings contains 21 symbols for drawing the computer network diagrams using the ConceptDraw DIAGRAM diagramming and vector drawing software.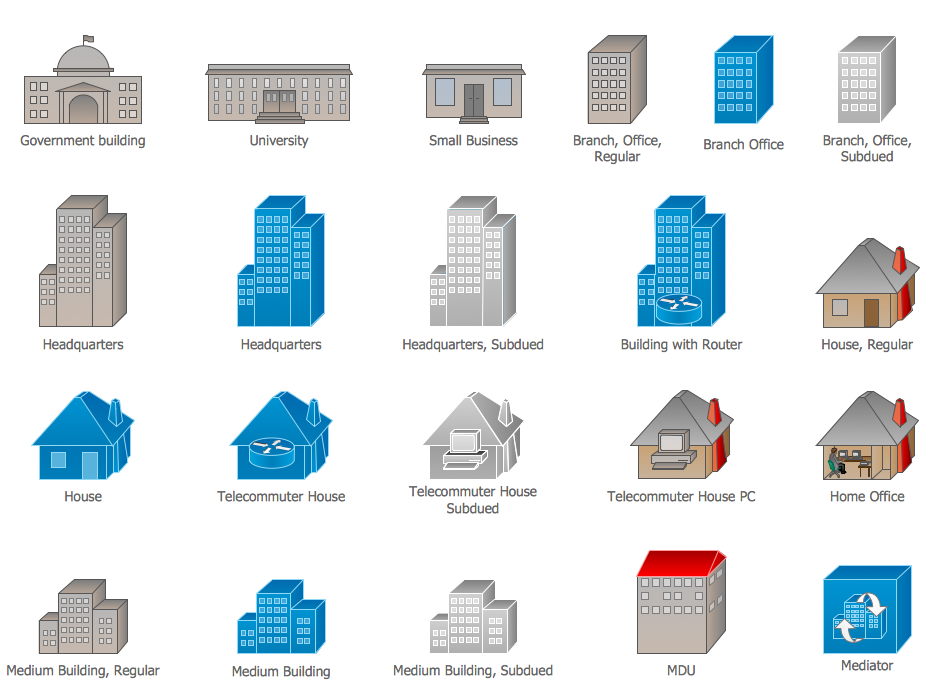
Picture: Cisco Buildings. Cisco icons, shapes, stencils and symbols
Related Solution:
Accounting is a cornerstone of any business, it’s basement. If you want to have a visual representation of your finance management, use audit flowchart symbols to document the money flow. Although some would say that accounting is boring, it is very a responsible duty.
The audit flowchart symbols is supplied with ConceptDraw Audit Flowcharts solution as a vector objects library. Together with Conceptdraw Drawing capabilities it forms the helpful tool for audit process planning and setting the steps of audit by designing audit flow charts. Audit Flow charts are used to organize fiscal information tracking process as well as in accounting, finance and investment management.
Picture: Audit Flowchart Symbols
Related Solution:
Informative and well-designed Infographics allows visually present various map containing information.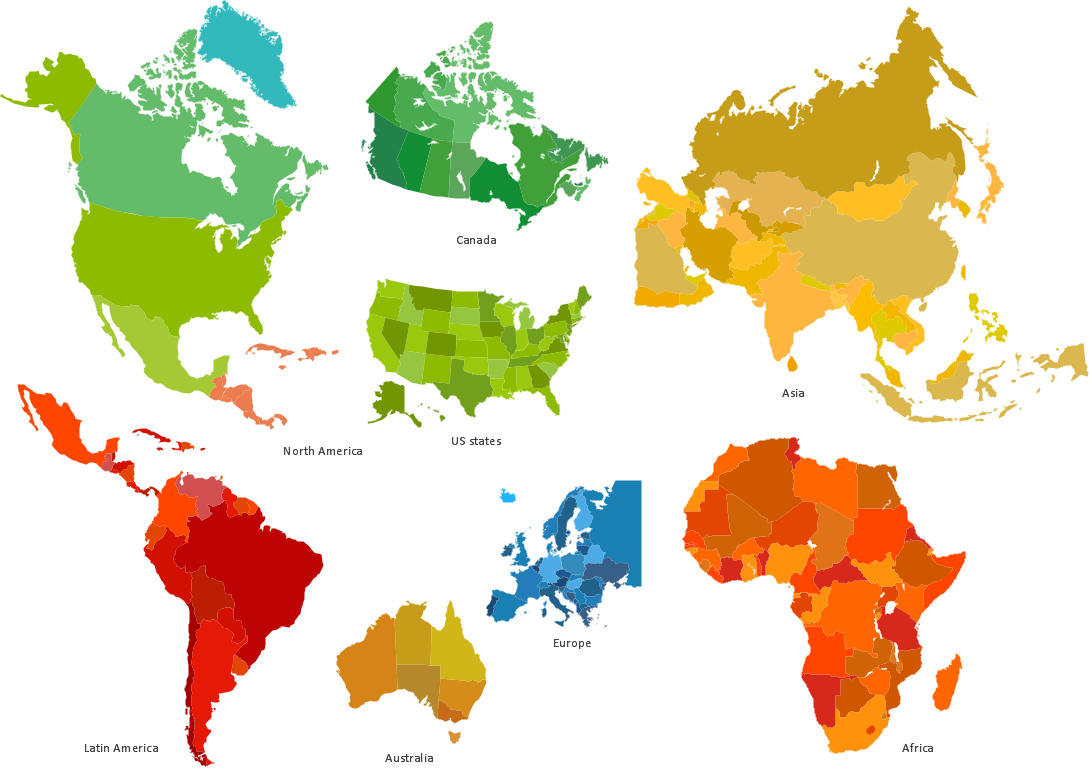
Picture: Informative and Well-Designed Infographics
Website wireframe is a detailed view of design or its skeleton. It shows all the important elements of the final website, the main groups of contents, information structure, describes the user's interaction with interface and its estimated visualisation.
ConceptDraw DIAGRAM extended with Website Wireframe solution from the Software Development area is the best wireframing software. Using the wireframe tools, libraries of vector objects, template and examples which offers a Website Wireframe solution, you will easily design the websites wireframes of any complexity.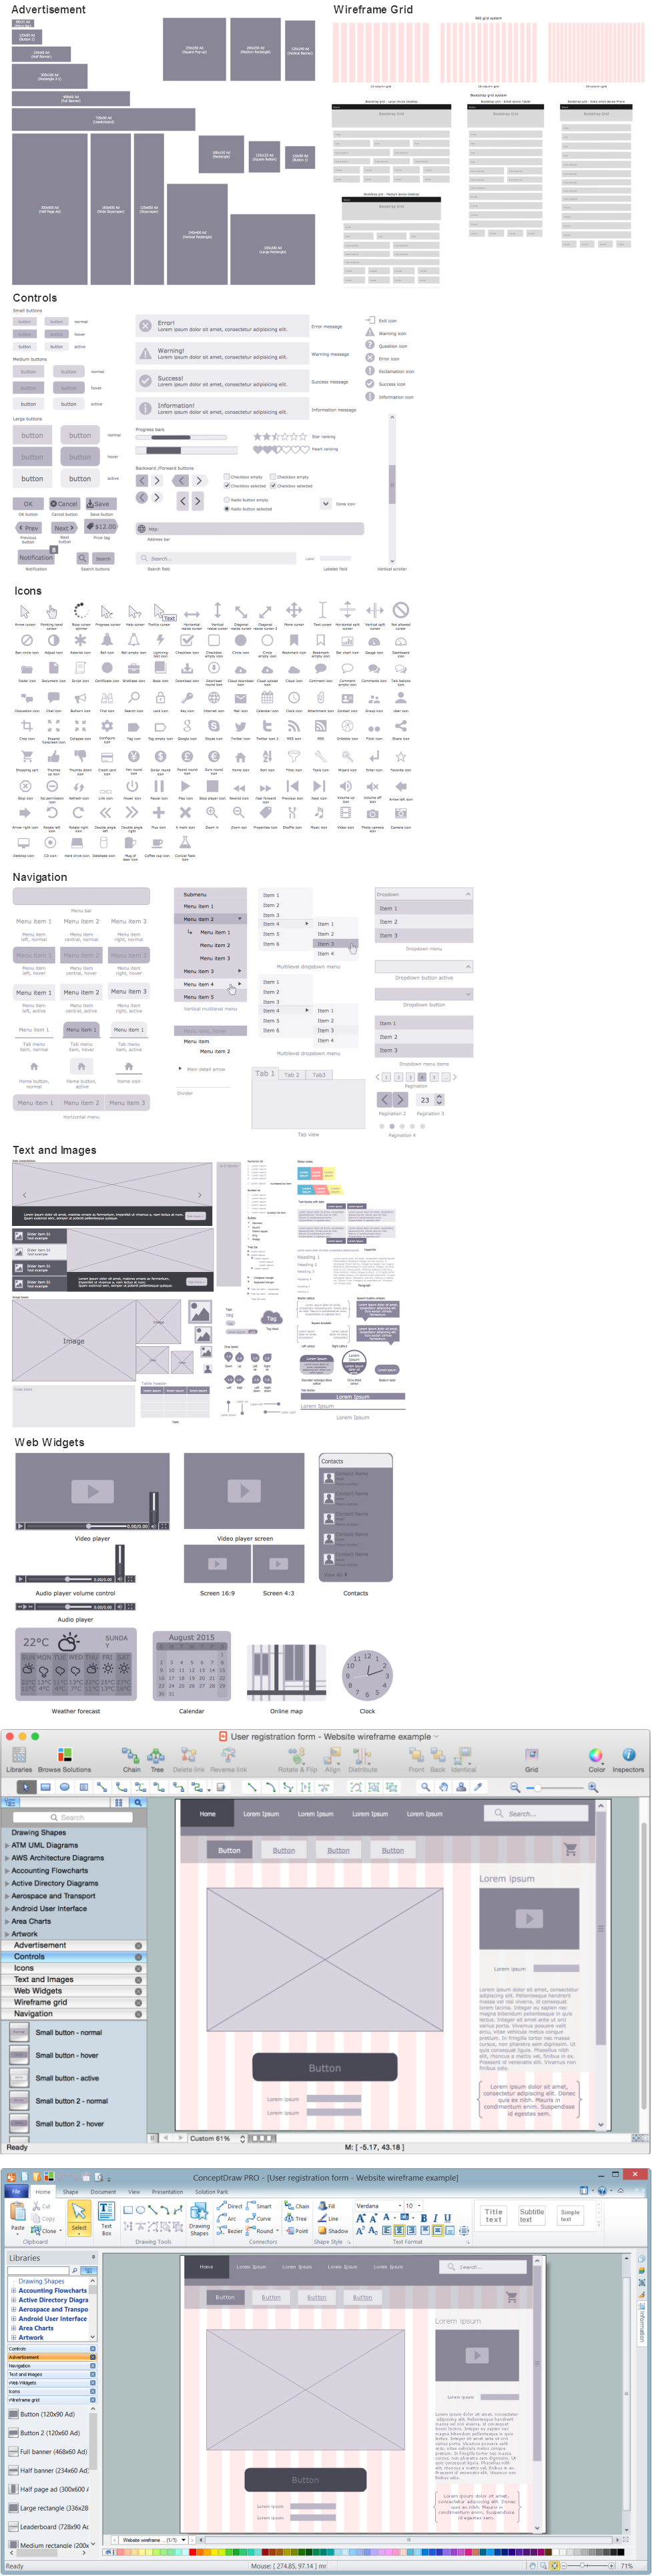
Picture: Wireframing
Related Solution:
Using diagrams, you can visualize the flow of the information or build a detailed data structure. There's no need to have a degree in software and database design with ConceptDraw DIAGRAM , because this software has all the tools needed in developing models and diagrams. Project planning, designing and prototyping was never so easy.
This UML diagrams can be used to visualize a model of the data base development process. A UML diagram shows a graphical view of a structure of software system: components and relationships.
Using Unified Modeling Language helps to depict logical and physical elements of a data base, visually represent requirements and sub-systems. UML diagrams allows developers to organize and predict critical issues, as well as collaborate data base information.
Picture: Software and Database Design with ConceptDraw DIAGRAM
Related Solution:
When trying to figure out the nature of the problems occurring within a project, there are many ways to develop such understanding. One of the most common ways to document processes for further improvement is to draw a process flowchart, which depicts the activities of the process arranged in sequential order — this is business process management. ConceptDraw DIAGRAM is business process mapping software with impressive range of productivity features for business process management and classic project management. This business process management software is helpful for many purposes from different payment processes, or manufacturing processes to chemical processes. Business process mapping flowcharts helps clarify the actual workflow of different people engaged in the same process. This samples were made with ConceptDraw DIAGRAM — business process mapping software for flowcharting and used as classic visio alternative because its briefly named "visio for mac" and for windows, this sort of software named the business process management tools.
This flowchart diagram shows a process flow of project management. The diagram that is presented here depicts the project life cycle that is basic for the most of project management methods. Breaking a project into phases allows to track it in the proper manner. Through separation on phases, the total workflow of a project is divided into some foreseeable components, thus making it easier to follow the project status. A project life cycle commonly includes: initiation, definition, design, development and implementation phases. Distinguished method to show parallel and interdependent processes, as well as project life cycle relationships. A flowchart diagram is often used as visual guide to project. For instance, it used by marketing project management software for visualizing stages of marketing activities or as project management workflow tools. Created with ConceptDraw DIAGRAM — business process mapping software which is flowcharting visio alternative or shortly its visio for mac, this sort of software platform often named the business process management tools.
Picture: Process Flowchart: A Step-by-Step Comprehensive Guide
Related Solution:
These employment forms will help you in the process of management, recruiting and hiring the employees.
Picture: Employment Form Software
Related Solution:
Create flowcharts, org charts, shipping flowcharts, floor plans, business diagrams and more with ConceptDraw. Includes 1000s of professional-looking business templates that you can modify and make your own.
Picture: Basic Diagramming
Related Solution: