Flowchart on Bank.
Flowchart Examples
This sample was created in ConceptDraw DIAGRAM diagramming and vector drawing software using the Flowcharts solution from the "Diagrams" area of ConceptDraw Solution Park.

Example 1. Flowchart solution with ConceptDraw STORE
This sample shows the Flowchart of the Subprime Mortgage Crisis. This Flowchart describes the decline in housing prices when the housing bubble burst and what it caused on the housing and financial markets. You can also see the Government and Industry responses in this crisis situation.

Example 2. Flowchart on Bank. Diagram of the Subprime Mortgage Crisis
This example was redesigned from the Wikimedia Commons file [commons.wikimedia.org]
The Flowcharts are widely used in:
- business,
- government,
- engineering,
- architecture,
- science,
- manufacturing,
- administration,
- etc.
Using the ready-to-use predesigned objects, samples and templates from the Flowcharts Solution for ConceptDraw DIAGRAM you can create your own professional looking Flowchart Diagrams quick and easy.

Example 3. Flowchart on Bank template and object
The Flowcharts produced with ConceptDraw DIAGRAM are vector graphic documents and are available for reviewing, modifying, and converting to a variety of formats (image, HTML, PDF file, MS PowerPoint Presentation, Adobe Flash or MS Visio).
See also Samples:
TEN RELATED HOW TO's:
Create bar charts for visualizing problem solving in manufacturing and economics using the ConceptDraw DIAGRAM diagramming and vector drawing software extended with the Bar Graphs Solution from the Graphs and Charts area of ConceptDraw Solition Park.
Picture: Bar Diagrams for Problem Solving. Create manufacturing and economics bar charts with Bar Graphs Solution
Related Solution:
Process Flow Charts are very popular and widely used in chemical and process engineering for representation a general flow of plant processes and equipment. If you need often draw them, the ConceptDraw DIAGRAM diagramming and vector drawing software extended with tools of Flowcharts Solution will be useful for you.
The mostly used set of process flow chart symbols includes the following: Rectangle (box) process flow chart symbol, Rounded rectangle, Circle, Diamond.
Picture: Process Flow Chart Symbol
Related Solution:
Also included are standardized hr flowchart symbols, meaning your diagrams will be relevant and understood by all business associates.
Picture: HR Flowchart Symbols
Related Solution:
This sample was created in ConceptDraw DIAGRAM diagramming and vector drawing software using the Cross-Functional Flowcharts solution from the Business Processes area of ConceptDraw Solution Park.
This sample shows the Swim Lanes Flowchart of Identification and logging.
Picture: Swim Lanes Flowchart. Flowchart Examples
Related Solution:
Accounts Payable Flowchart - There is nothing easier than do it in ConceptDraw DIAGRAM. ConceptDraw DIAGRAM diagramming and vector drawing software provides the Accounting Flowcharts Solution from the Finance and Accounting Area of ConceptDraw Solution Park.
The Accounting Flowcharts Solution contains templates, samples and library of ready-to-use predesigned vector objects that will help you create: accounts payable flowchart, accounts payable process flow chart, accounting flowchart of any complexity quick and easy.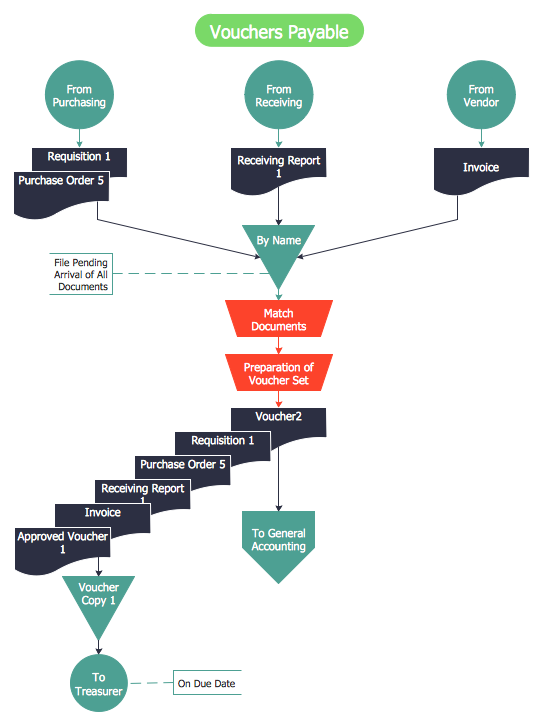
Picture: Accounts Payable Flowchart
Related Solution:
Services UML Diagram. ATM system. This sample was created in ConceptDraw DIAGRAM diagramming and vector drawing software using the UML Use Case Diagram library of the Rapid UML Solution from the Software Development area of ConceptDraw Solution Park.
This sample shows the scheme of the servicing using the ATMs (Automated Teller Machines) and is used at the working of ATM banking systems, at the performing of the banking transactions.
Picture: UML Use Case Diagram Example. Services UML Diagram. ATM system
Related Solution:
This sample shows the Flowchart of the ACC general account creation. This Flowchart describes the Start point, the process of the handling the user requests and the End point – creating of the account. The shapes represent the subprocesses and the arrows between the shapes shows the sequence of the actions.
This sample was created in ConceptDraw DIAGRAM diagramming and vector drawing software using the Flowcharts solution from the Diagrams area of ConceptDraw Solution Park.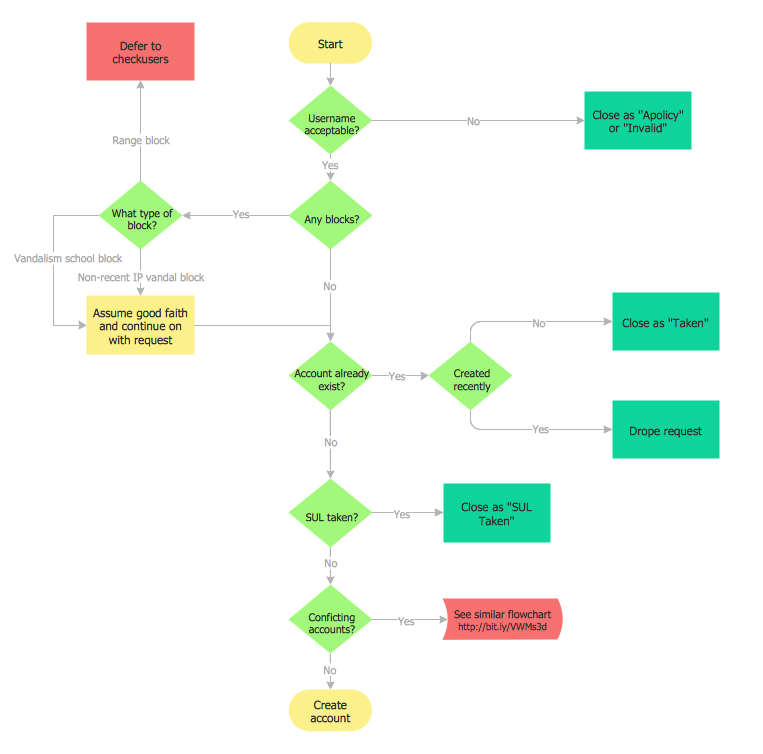
Picture: Examples of Flowchart
Related Solution:
To your mind, deliberation about the profits of creating organizational charts takes more time than actually creating itself. If lack of software is the only thing that stops you, you should know that organizational charts with ConceptDraw DIAGRAM are created within a few minutes. Owing to the great number of ready-to-use templates, you’ll get your chart easily.
Chart is a very handy format for visually depicting official relations of an organization. Usually, an Orgchart (organizational chart) consists from simple geometrical shapes, containing an information on a position, personal data, and the lines that means responsibilities and accountabilities associated with position. ConceptDraw solution designed for making organizational charts enables one to create various org charts effortlessly using special templates and vector libraries.
Picture: Organizational Charts with ConceptDraw DIAGRAM
Related Solution:

