Made with
ConceptDraw
DIAGRAM 18

Data modeling with ConceptDraw DIAGRAM

One of the most difficult and important problems at software and data base projection is the definition of the requirements to the result. The more time is spent and the more attention is paid to the projecting software or data base, the simpler is the projection and the more qualitative is the result. The most frequently for definition of the requirements the method of data modelling is used.

In the given case data modelling presents the process of creation of data model in the convenient and comprehensible graphic form. In the process of model creation data is structured and organized with the usage of one of the methods, such as IDEF or ERD.

A creation of the model consists in collection of data which will be used in the projecting data base in the capacity of entities and other data base objects, in the definition of behavior rules of data in the system and operators which address to data in data base.

The model of data describes the structure of data in the given area. It contains the information about the classes of entities (for which the information is needed), attributes of this information and connections (including implicit) between entities and attributes of entities.

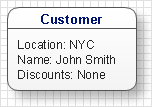
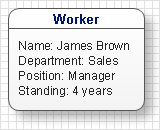
Entities are the objects of business-processes, real or virtual about which the information is collected and which are described in the model of data. For instance, entities can be all people having relation to the work of an enterprise. In their turn these entities are divided into classes. For example: “Clients”, “Suppliers”, Workers”. Each of the classes can be divided into subclasses by the given attributes. Classes are named with words of usual non technical language as well as connections between classes.

After the entity determination it is described with some definitions which are the attributes of the entity. Attributes must identify the entity, classify and appraise it qualitatively and quantitatively. Attributes can be obligatory and optional. For the entity “Worker” these can be individual data (name, age, and address), professional data (education, qualification, position) and so on. Attributes which originally define the entity are called primary.

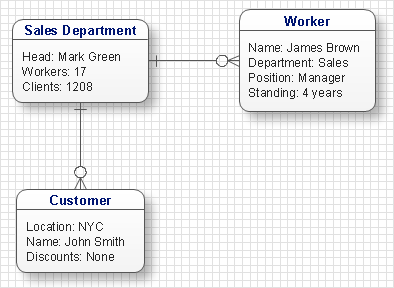
After the definition of entities and their attributes in the model of data connections between entities and the type of these connections are defined. Connections can be unidirectional and bidirectional. Also the types of connections are distinguished: “one to one”, “one to many” or ”many to many”. Connections are called with verbal names. For example, between the entity “Worker” and entity ”department” there is a unidirectional connection of the type “One to one”. “Worker” works in the ”Department”. If consider the class of entities “Worker” the connection of this class with the entity “Department” will be of the type “one to many”.

The model of data describes semantics of data i.e. the set of confirmations about data which are used in the project.

The model of data can be presented in one of three forms:

  • Conceptual scheme- the description of semantics of data organization (entities classes and connections between these classes)
  • Logic scheme- description of data (tables, object oriented classes)
  • Physical scheme- description of physical environment of data keeping and processing

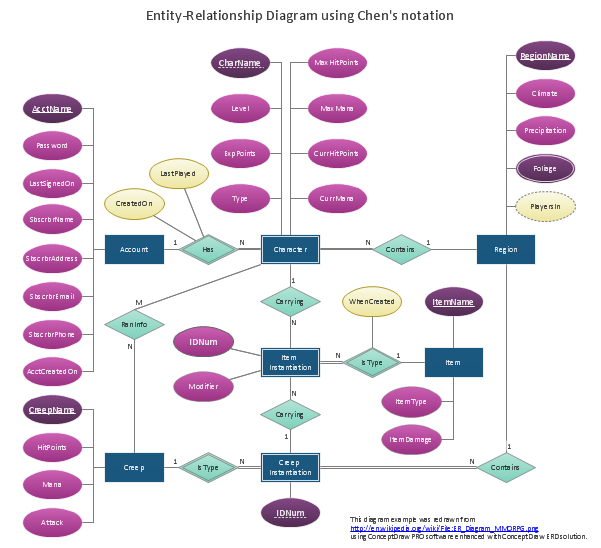
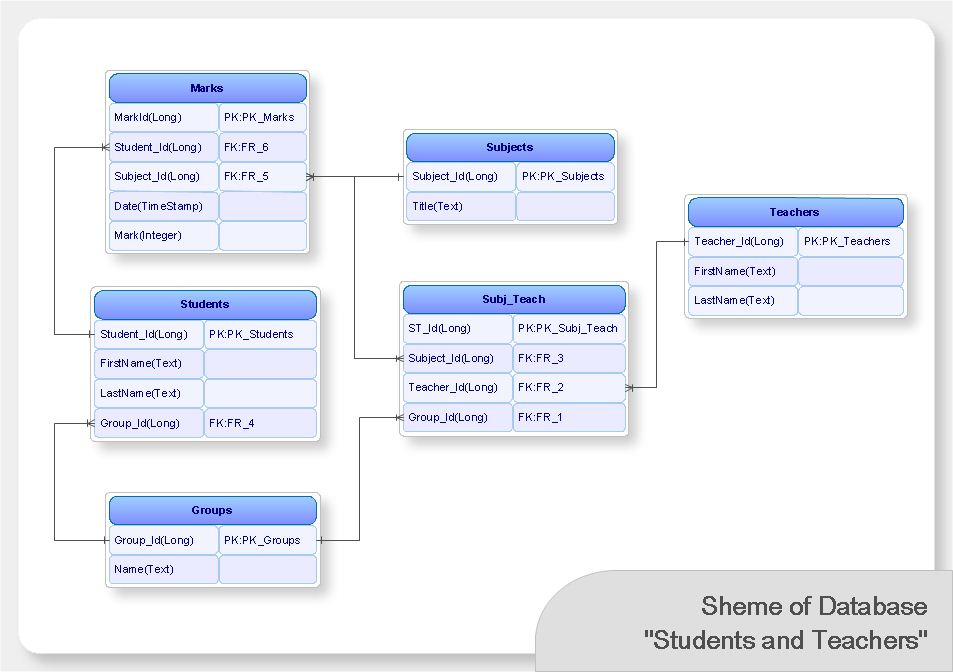
The more commonly used technologies of creation of such schemes are ERD (Entity Relationship Diagram) and some of IDEF standards (IDEF1, IDEF1x). Also for creation of schemes or diagrams which describe models of data it is possible to use special software such as ConceptDraw, where ready objects for creation of such diagrams exist. This lets you facilitate and accelerate the process of creation of such schemes and diagrams, creating diagrams which will be easy edited in the projection process.

Data modelling will help you to study and analyze business processes in your organization for optimization and increase of effectiveness and production.

Data modeling with ConceptDraw DIAGRAM  *

TEN RELATED HOW TO's:
A Data Flow Diagram (DFD) is a graphical technique which allows effectively model and analyze the information processes and systems. The ability to fast and easy create the DFDs is made possible with Data Flow Diagrams solution from the Software Development area of ConceptDraw Solution Park. For designing the Data Flow Diagrams are used simple DFD flowchart symbols which are connected each other by arrows depicting the data flow from one step to another.DFD Flowchart Symbols *
Picture: DFD Flowchart Symbols
Related Solution:
The Social Media Response solution provides the means to respond to social media mentions quickly and professionally. This tool keeps the entire team on the same page allowing you to realize your social media strategy, improve the quality of your answers, and minimize the time it takes to respond.Manage Social Media Response Plan DFD *
Picture: Manage Social Media Response Plan DFD
Related Solution:
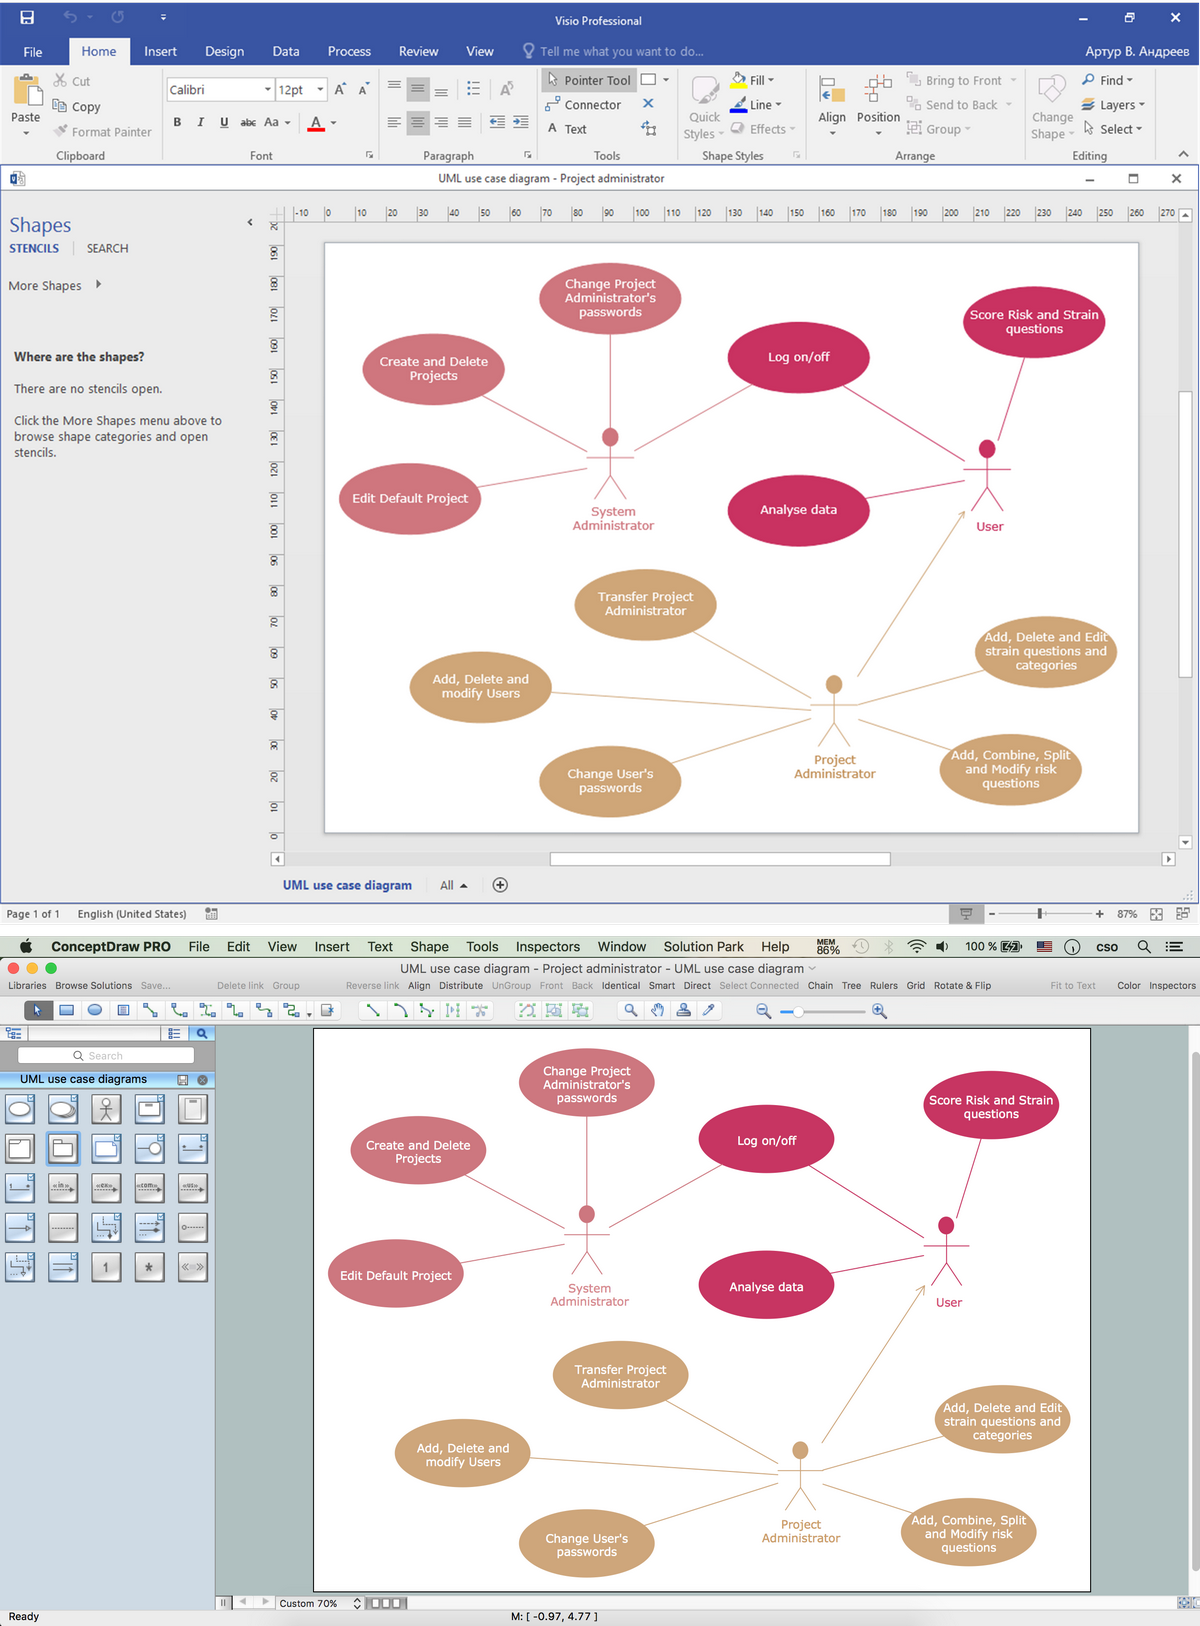
Use case diagrams are used at the development of software and systems for definition of functional system requirements or system of systems. Use case diagram presents the consecution of object’s actions (user’s or system’s) which are executed for reaching the definite result.Use Case Diagrams technology with ConceptDraw DIAGRAM  *
Picture: Use Case Diagrams technology with ConceptDraw DIAGRAM
When we think about programming, we usually imagine sleepless nights spent on writing kilobytes of code. However, from another point of view, Software development with ConceptDraw DIAGRAM makes a programmer's life endlessly easier. This tool is unique to fulfill all your needs in short period of time. Over the recent years object-oriented methodology has become more and more widespread. Thanks to this methodology developers manage to deal with growing complexity of applications. More and more programs are written in such programming languages as C++, Java, Visual Basic and Object Pascal. However, the complexity of the designed systems imposes extended requirements as to design of graphic documentation. ConceptDraw possesses powerful tools for designing of technical documentation for object-oriented projects. The libraries included in the package allow to easily draw class hierarchies, object hierarchies and diagrams of data flows with the use of the most popular notations, including UML and Booch notations. And the library for projecting COM-interfaces will spare developers of ActiveX-servers a headache.Software development with ConceptDraw DIAGRAM  *
Picture: Software development with ConceptDraw DIAGRAM
Workflow Diagram - workflow process diagram is a visual representation of a organizational process flow. Often it used as the same visual notation as process flow diagram. Visualising business processes using workflow diagram (workflow process diagram) allows estimate business process efficiency, analyse and optimize the process itself. Workflow diagram helps get focusing on each step and relations between workflow steps. ConceptDraw DIAGRAM is software for making workflow diagram. It contains specific designed graphics to draw workflow diagrams effectively. This is workflow diagram maker which do your work process effective.Work Flow Process Chart *
Picture: Work Flow Process Chart
Related Solution:
ConceptDraw DIAGRAM is a best business processes modeling software for graphical documenting processes of the company.Business Process Modeling Resume *
Picture: Business Process Modeling Resume
Data modelling will help you to study and analyze business processes in your organization for optimization and increase of effectiveness and production.Data modeling with ConceptDraw DIAGRAM  *
Picture: Data modeling with ConceptDraw DIAGRAM
As restaurant industry is growing rapidly nowadays, researches show that almost half of the adults have worked in a restaurant or a cafe. Moreover, many of them dream to start their own someday. Unfortunately, it takes a lot of time to write a business plan and to find a great location, although some know how to create a restaurant floor plan in minutes or how to plan budget effortlessly. Hiring employees can also cause a lot of headache, but this is crucial for further success, because every guest comes to restaurant for a good service and delicious food. It is also worth noting that restaurant concept is also important, because it defines target audience and influences the menu. This diagram represents the floor plan of an ongoing sports-theme establishment - restaurant, cafe, or other food service. A number of widescreen monitors installed along the perimeter provide visitors the opportunity to follow the course of a match from anywhere in the dining room of restaurant or cafe. The most of sports fans believe that food and alcohol is a big part of any sports show. That is why the dining room takes the most space - almost 60% of the total establishment space. Nearly all sports fans consume beverages while watching sports - beer, soda or water at least. Thus, the restaurant floor plan designers added a large lavatory there. Moreover, project developers considered unnecessary the gender division of such delicate place - perhaps they guess that only men are watching football, or believe that alcohol will eliminate the most of gender differences.Restaurant Floor Plan
Picture: How To Create Restaurant Floor Plan in Minutes
Related Solution:
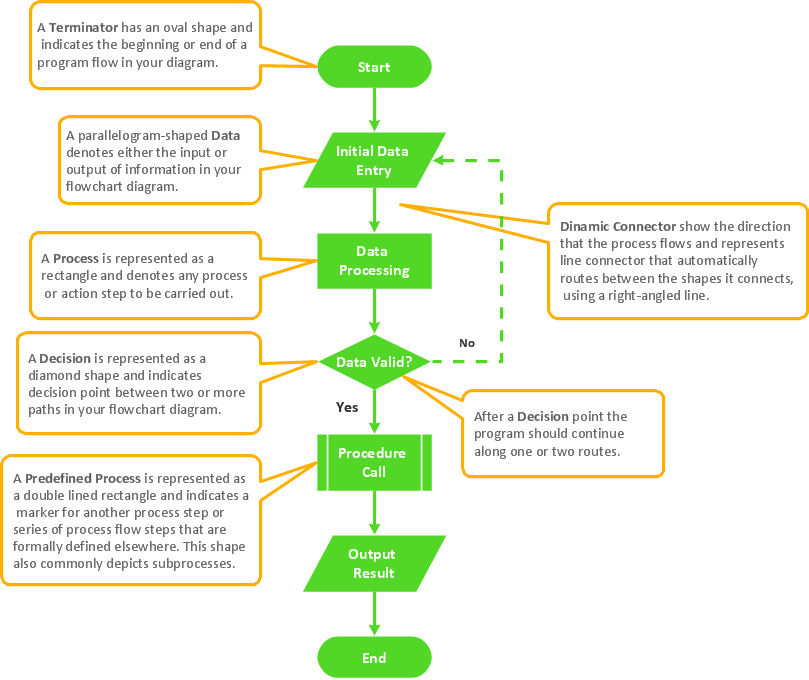
While creating flowcharts and process flow diagrams, you should use special objects to define different statements, so anyone aware of flowcharts can get your scheme right. There is a short and an extended list of basic flowchart symbols and their meaning. Basic flowchart symbols include terminator objects, rectangles for describing steps of a process, diamonds representing appearing conditions and questions and parallelograms to show incoming data. This diagram gives a general review of the standard symbols that are used when creating flowcharts and process flow diagrams. The practice of using a set of standard flowchart symbols was admitted in order to make flowcharts and other process flow diagrams created by any person properly understandable by other people. The flowchart symbols depict different kinds of actions and phases in a process. The sequence of the actions, and the relationships between them are shown by special lines and arrows. There are a large number of flowchart symbols. Which of them can be used in the particular diagram depends on its type. For instance, some symbols used in data flow diagrams usually are not used in the process flowcharts. Business process system use exactly these flowchart symbols.Flowchart example showing a customer request approval process with start, input output, process steps, decision branches, and end
Picture: Flowchart Symbols: Meaning and Examples
Related Solution:
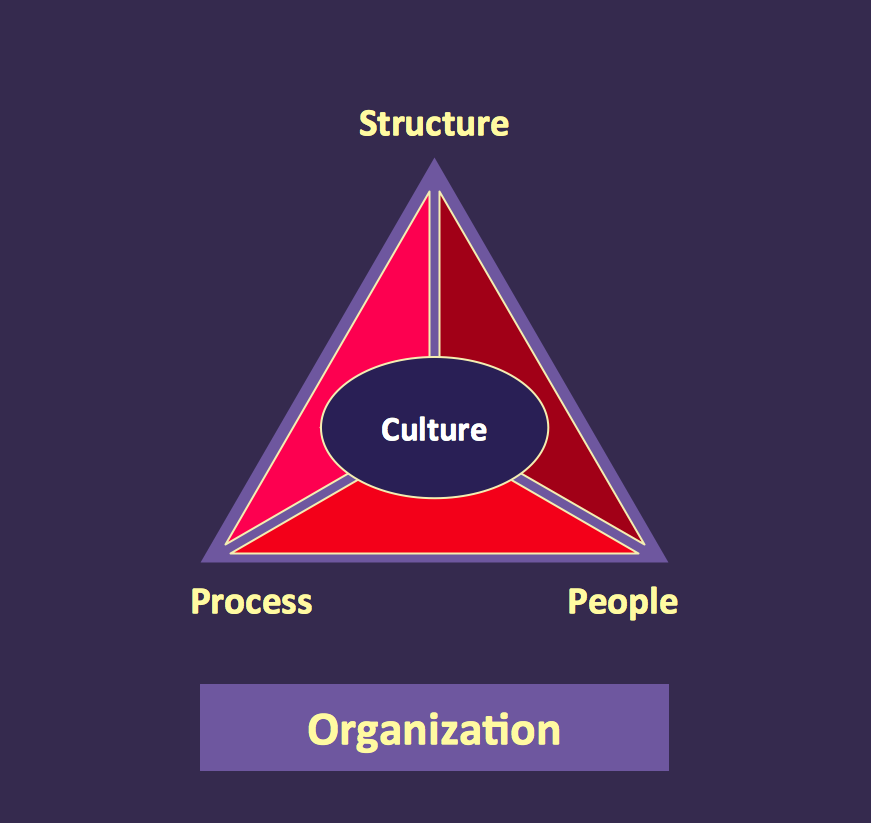
The Total Quality Management Diagram solution helps you and your organization visualize business and industrial processes. Create Total Quality Management diagrams for business process with ConceptDraw software.TQM Diagram Example *
Picture: TQM Diagram Example
Related Solution:
ConceptDraw
DIAGRAM 18