Create Graphs and Charts
ConceptDraw DIAGRAM
The ConceptDraw DIAGRAM is a professional software for the great looking graphs and charts designing. Many vector symbols, samples and templates, created by designers, allow you to instantly start draw any type charts or graphs. The main idea of the data graphical representation is a chart, where data is represented by bars in a bar chart, lines in a line chart, or slices in a pie chart. Other side of the charts is a flow chart, organization chart or other representation of the structural or flow data.
Charts provide faster readiness than the raw data, that they are made of. They can be created by hand or using the ConceptDraw DIAGRAM software.

Sample 1. Document flow chart sample.
This example of business process cross-functional flow chart depicts document flow steps.
Use ConceptDraw DIAGRAM software for quick and easy creating your own cross-functional flow charts.
See also Samples:
NINE RELATED HOW TO's:
Learn about Virtual Private Networks (VPNs), and how they work, exploring VPN Networks with diagrams. ✔️ How to create VPN flowcharts using the ConceptDraw DIAGRAM software?
Picture:
What is a Virtual Private Network?
VPN Diagram Examples
Related Solution:
A floor plan is an essential element of any building or architectural plan. It shows a view from above of relationships between physical features on one floor of a structure. Thanks to modern digital drawing tools, you can easily learn how to create floor plans. Software like ConceptDraw DIAGRAM provides an intuitive and modern interface and an assortment of powerful tools, so that nothing will get in the way of your creativity.
When considering a moving to a new office, or making rearrangement of an office, its better to draw an office floor plan picture. The objective of any office space organization is to maintain a business functionality in a proper manner. This diagram illustrates a layout of usual cubical office. It shows just walls, windows and cubicles. You can use it as a template for your custom office layout diagram. the all you need is to launch ConceptDraw DIAGRAM with its Office Plans solution. Then, you can make changes and add necessary equipment, using the vector objects library, supplied with solution.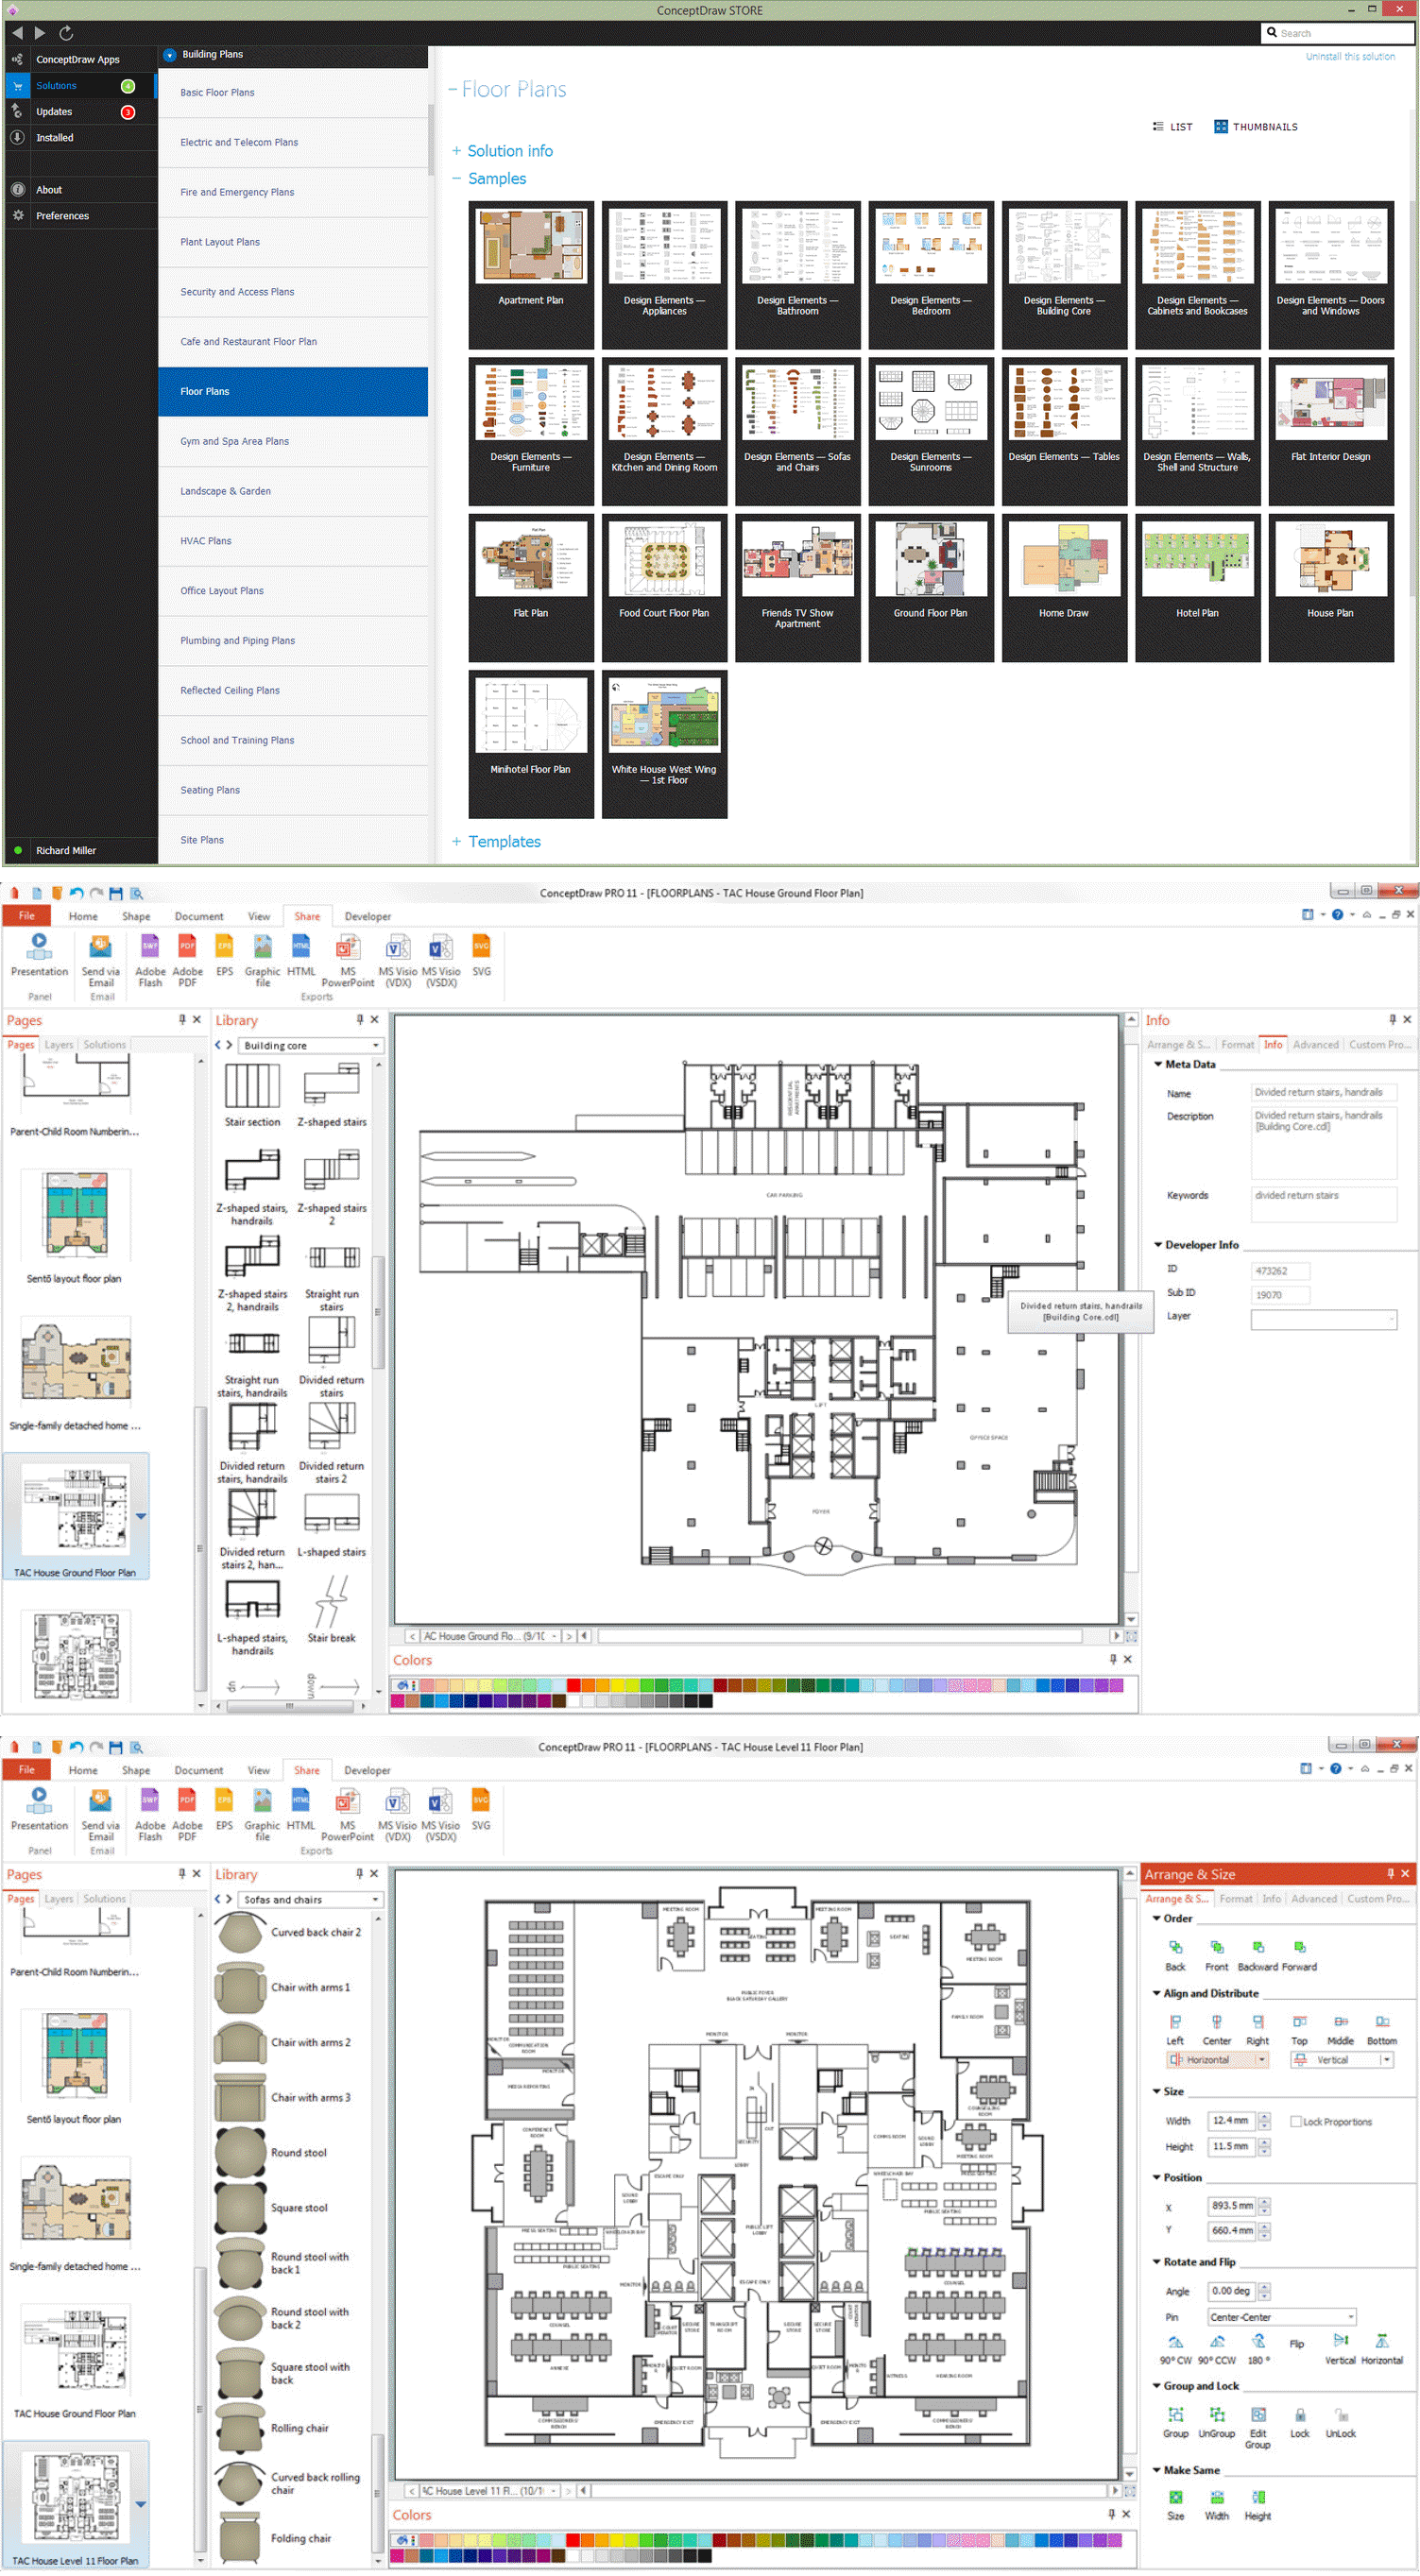
Picture: How To Create Floor Plans
Related Solution:
Engineering students usually have huge amount of homework. Learning how to develop a technical drawing is one of the necessary skills. Luckily, at the present time, there’s no need to draw it on paper, because there a lot of software tools for it.
This drawing represents the Bearing symbols library, that is the part of the ConceptDraw Mechanical Engineering solution. Bearings are the important components of any movable mechanism. The function of bearing is to align, guide, and support the moving parts in any mechanical construction. Usually they are located between moving and stationary parts, it works as a connection point between them. Using Mechanical Engineering solution and ConceptDraw DIAGRAM one can effortlessly draw engineering diagrams of any complexity.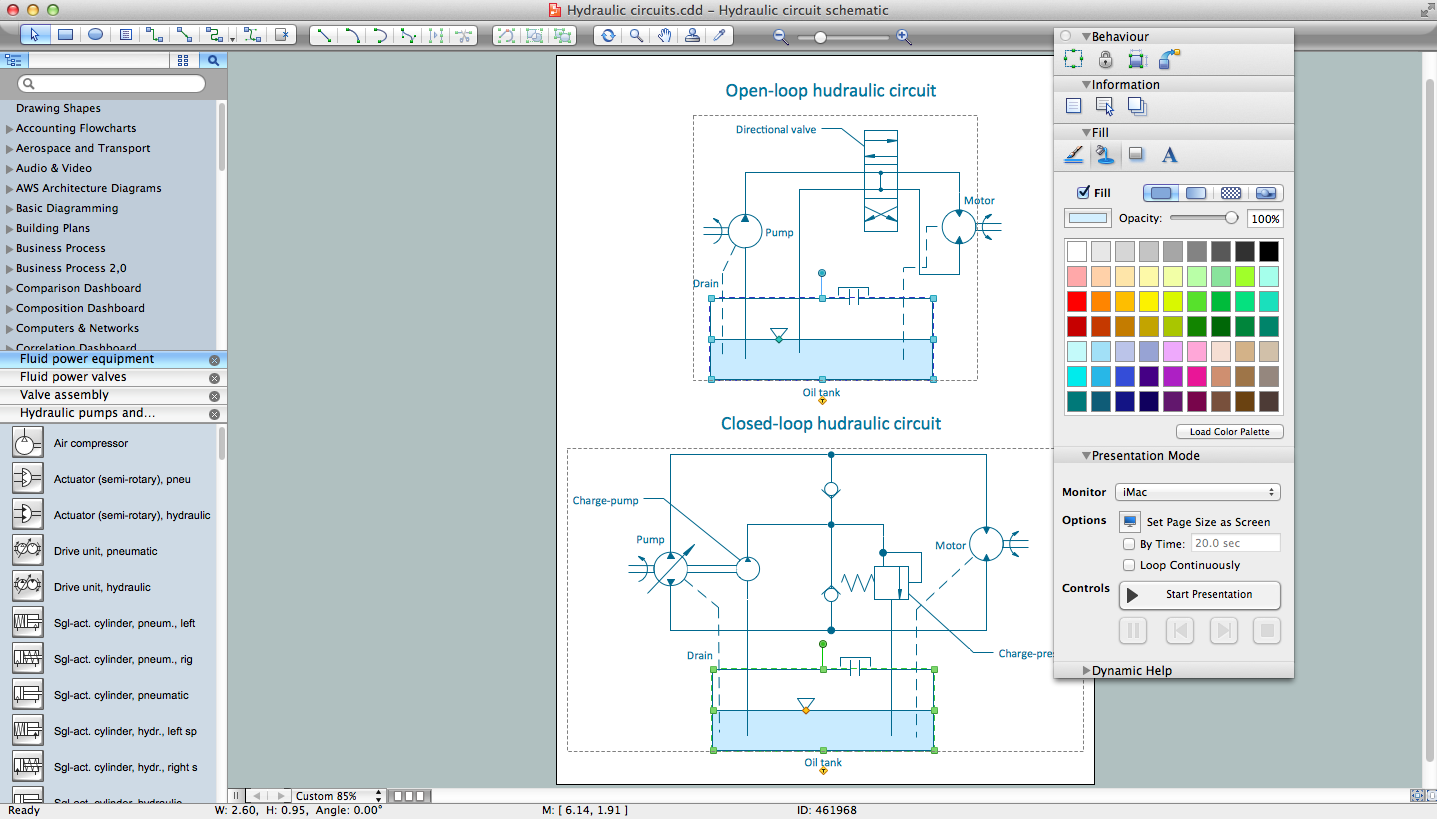
Picture: Technical Drawing Software
Related Solution:
Use ConceptDraw DIAGRAM diagramming and vector graphics software to visually model your own IT construction processes.
Picture: How to Create a Process Flowchart
Related Solution:
This sample was created in ConceptDraw DIAGRAM diagramming and vector drawing software using the Bubble Diagrams Solution from the Diagrams area of ConceptDraw Solution Park.
This sample clearly shows the Four Dimensions Bubble Diagram of the distribution of chlorine contaminant in the water source. This Bubble Diagram is very useful in the chemistry, hydrology, and ecology.
Picture: Four Dimensions Bubble Plot
Related Solution:
How to draw pictorial chart quick, easy and effective? ConceptDraw DIAGRAM offers the unique Pictorial Infographics Solution that will help you!
Pictorial Infographics solution contains large number of libraries with variety of predesigned vector pictograms that allows you design infographics in minutes. There are available 10 libraries with 197 vector pictograms.
Picture: How to Draw Pictorial Chart. How to Use Infograms
Related Solution:
It is impossible to imagine mechanical engineering without drawings which represent various mechanical schemes and designs. ConceptDraw DIAGRAM diagramming and vector drawing software supplied with Mechanical Engineering solution from the Engineering area of ConceptDraw Solution Park offers the set of useful tools which make it a powerful Mechanical Drawing Software.
Picture: Mechanical Drawing Software
Related Solution: