BPR Diagram.
Business Process Reengineering Example
Business process re-engineering is a business management strategy, focusing on the analysis and design of workflows and business processes within an organization. BPR aimed to help organizations fundamentally rethink how they do their work in order to dramatically improve customer service, cut operational costs, and become world-class competitors.
BPR seeks to help companies radically restructure their organizations by focusing on the ground-up design of their business processes. Business process is a set of logically related tasks performed to achieve a defined business outcome. Re-engineering emphasized a holistic focus on business objectives and how processes related to them, encouraging full-scale recreation of processes rather than iterative optimization of sub-processes.
Business Process Reengineering is also known as business process redesign, business transformation, or business process change management.
This sample was created in ConceptDraw DIAGRAM diagramming and vector drawing software using the Business Process Diagram Solution from the Business Processes area of ConceptDraw Solution Park. The Business Process Solution is based on the standard BPMN 2.0 and includes the set of libraries of ready-to-use objects.
This sample shows the diagram of Business Process Reengineering Cycle. The Business Process Reengineering (BPR) is a strategy of business management that helps companies restructure their organizations. Reengineering focuses on the design and analysis of business processes. Reengineering also redesigns the business processes to achieve the improvements in the critical performance measures of organization.

Pic.1 Business Process Reengineering Cycle
Using the libraries of the Business Process Diagram Solution for ConceptDraw DIAGRAM you can create your own professional Business Process Diagrams quick and easy.
The Business Process Diagrams produced with ConceptDraw DIAGRAM are vector graphic documents and are available for reviewing, modifying, and converting to a variety of formats (image, HTML, PDF file, MS PowerPoint Presentation, Adobe Flash or MS Visio).
TEN RELATED HOW TO's:
The Workflow diagrams are the specialized type of flowcharts which allow to visualize any sorts of step-by-step processes. They are usually created as flowcharts, with objects that represent in a simple visual manner the steps in the process connected by arrows that indicate the next step. The ability easily create Workflow diagrams visually describing the tasks, documents associated with the tasks, people which are responsible for execution at each stage of workflow is made possible with Workflow Diagrams solution. This solution extends ConceptDraw DIAGRAM with a Workflow Diagram library that contains large collection of predesigned workflow flowchart symbols.
Picture: Workflow Flowchart Symbols
Related Solution:
This sample shows the Data Flow Diagram of the Taxi Service and interactions between the Clients, Operators and Divers, as well as Orders and Reports databases.
Picture: Taxi Service Data Flow DiagramDFD Example
Related Solution:
Bubble diagrams solution extends ConceptDraw DIAGRAM software with templates, Using ConceptDraw Connectors, you can create a bubble chart in moments.
Using ConceptDraw you will be able to create a bubble chart from the ready ConceptDraw library objects or make your own objects. The created diagram can represent ideas organization, in brainstorming processes, by teachers for explaining difficult ideas or for presentations.
Picture: How To Create a Bubble Chart
Related Solution:
This sample was created in ConceptDraw DIAGRAM diagramming and vector drawing software using the Flowcharts solution from the Diagrams area of ConceptDraw Solution Park.
This sample shows the Flowchart of the Credit Card Order Process. On this diagram are used the flowchart symbols that represents the processes and documents. The flowchart symbols are connected with arrows.
Picture: Credit Card Order Process Flowchart. Flowchart Examples
Related Solution:
Electrical engineering is a field of engineering that generally deals with the study and application of electricity, electronics, and electromagnetism. ConceptDraw DIAGRAM extended with Electrical Engineering Solution from the Industrial Engineering Area of ConceptDraw Solution Park is the best Electrical Engineering software. You have an excellent possibility to make sure this right now.
Picture: Electrical Engineering
Related Solution:
The first step to improve your workflow is to draw it down. When the workflow is visualised you are able to analyse it, to find excess or missing steps or relations. Changing the workflow on paper you can pass as many iterations as needed to get the optimal process, and then start implementing changes to the real process. The best software helps you with workflow is ConceptDraw DIAGRAM software extended with the Workflow Diagram solution. It contains all tools, features, samples and templates you may need during drawing workflow, analysis, and then presenting and implementing your results.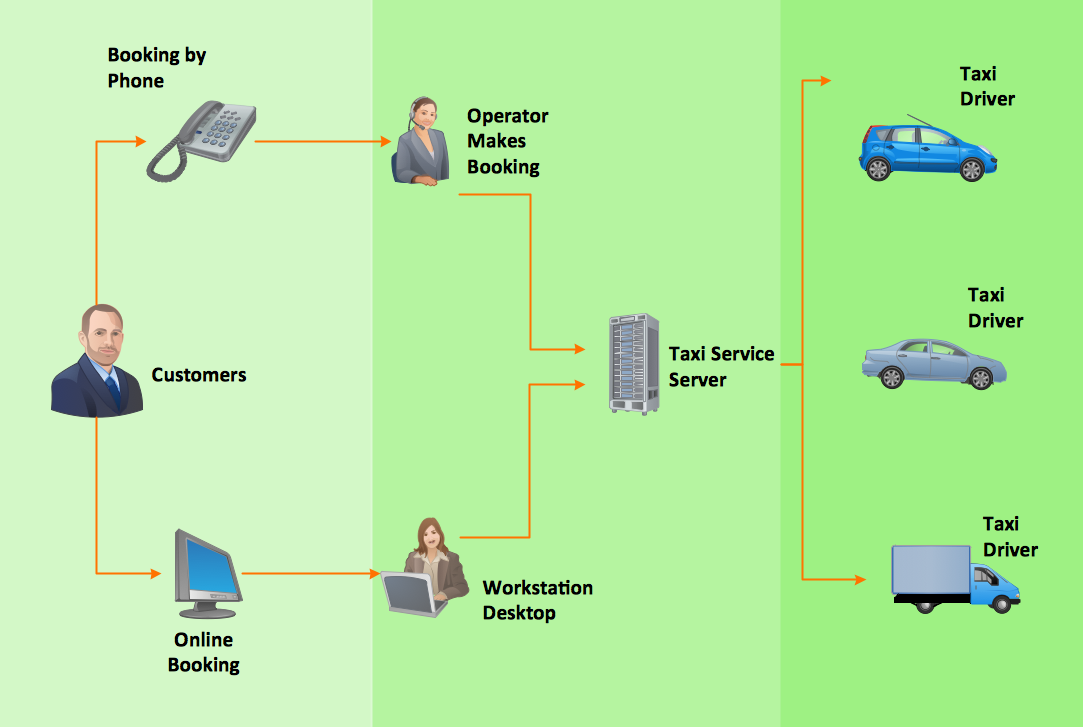
Picture: Tools and Software to Improve Your Workflow
Related Solution:
The Accounting flowchart shows how information flows from source documents through the accounting records. The are based on the accounting procedures or processes.
Flowcharts are used to represent accounting information in a system. There are special symbols which are used to create accounting flowcharts. Try conceptdraw flowcharting set of symbols to draw a professional charts.
Picture: Why Flowchart Important to Accounting Information System?
Related Solution:
Visual information is easier to perceive. You can teach even a child to make diagrams with a good flowchart example that would be interesting for it. Flowcharts can be fun, it’s not about business processes or programming algorithms.
This flowchart shows step by step process of manufacturing of Nixtamal The product which is obtained by processing maize with calcium hydroxide. We must assume that the Aztecs were very fond of this product, if the recipe of its production came to our times. This flow chart was designed using ConceptDraw DIAGRAM with its solution for designing flowcharts of various types, sizes and purposes. ConceptDraw Flowcharts solution consists from the library of flowchart symbols, containing the set vector objects. Also there are a lot of diverse templates and samples of flow charts.
Picture: Flowchart Examples and Templates
Related Solution:
In order to be successful, you have to promote your business on the market. One of the ways for planning this promotion is to create a social media DFD Flowchart which will contain all the details of your business strategy. Social media is a very influential tool, and it's a mistake to ignore it.
The following flowchart represents a best way to estimate social media posts, and gives a strategy of responses. This flowchart is designed in the format of cross-functional flowchart. With this format, we can divide the process into three distinct phases. This approach helps to generate well-considered and balanced response on social networks activities. Using ConceptDraw solution for Social Media Response, your reaction to social media posts will positively mirror the values and mission of your business.
Picture: How to Create a Social Media DFD Flowchart
Related Solution: