
Types of Flowcharts
Planning a new project or representing process operations, illustrating the solutions to appeared problems as well as analyzing, designing, documenting, managing processes in various fields, you find it necessary to structure everything and put things in order with help of the right software which should be suitable for you and easy in use as it’s important to simplify things, not to complicate. Using ConceptDraw DIAGRAM you’ll make different flowcharts and their types which are numerous depending on the sourced data and field of activity mentioned. Try to make a basic one first and then go to the next level creating business process one, cross functional or data flow, event-driven process chain diagram and many more. IDEF flowchart will be helpful in creating function models, developing transition schematics, designing system architecture, making object-oriented design. Influence, swim lane, process and work flow diagrams, specification and description language ones as well as value stream mapping can be made in ConceptDraw DIAGRAM within short period of time with help of their layouts from Solution Park.
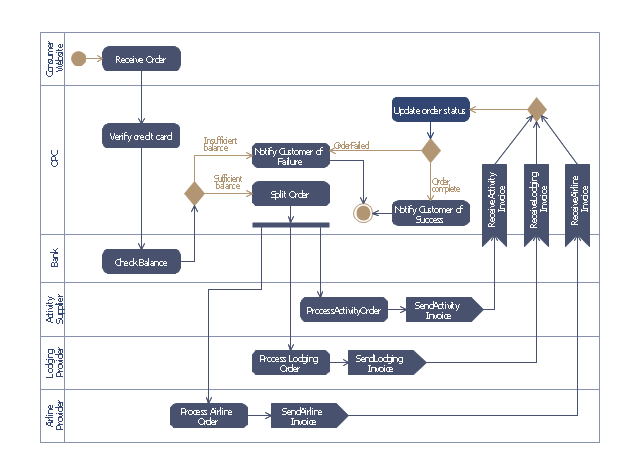
Structured Systems Analysis and Design Method (SSADM)
Structured Systems Analysis and Design Method (SSADM) was developed in the UK in the early 1980s and accepted in 1993 in order to analyze and project the information systems. Use the data flow diagrams (DFD) for describing the informational, functional and event-trigger models, the Logical Data Structure (LDS) diagrams for describing which data the system operates with and Entity Life History (ELH) diagrams for modelling events that happened in the system and find it simple to make any of these or other diagrams with help of our software. No matter what kind of flowcharts you decided to create, you can always do it using our ConceptDraw DIAGRAM product with help of Solutions sector on this site as well as STORE application which you can download to use the existing layouts from. Starting now, you’ll definitely make a better chart tomorrow, so why not to do it now, at this very moment? Once you get used to ConceptDraw DIAGRAM , you’ll find our product to be the most smart version of any existing applications and you’ll recommend it to all those who you care for to simplify their work and their lives.
Pyramid Diagram . Five level pyramid model
Pyramid Diagrams. 5 level pyramid model of information systems types
DFD Library System
Context-level Data Flow Diagram or DFD is quite popular in order to show the interaction between the system and external agents which act as data sources and data sinks. Such diagrams help to illustrate the entire system as a single process, and gives no clues as to its internal organization. A System Context Diagram (SCD) defines the boundary between the system, or part of a system, and its environment, showing the entities that interact with it. Having ConceptDraw DIAGRAM software allows you to make any of mentioned above diagrams as well as create many other diagrams, charts, flowcharts, schemes and plans to be able to have a great looking, very smart, sophisticated and professional result as if you were professional creating all of those flowcharts having any design element you need taken from one of numerous libraries available for our users’ use. Find yourself feeling as if you were a specialist having many years of experience in drawing all of the diagrams we’ve discussed as well as other charts simply having ConceptDraw DIAGRAM tool downloaded to your desktop.ERD Symbols and Meanings

ERD Symbols and Meanings
Modeling your data using entity-relationship diagram (ERD) with Crow's Foot notation which is popular in Structured Systems Analysis, Barker's Notations, Design Methods and information engineering you need the software that is easy in use having all necessary elements for creating the needed flowcharts as well as their examples. You can find all essential ERD symbols and its meanings on our site with tutorials of how to use it and you can always use the already existing layouts for making your own diagrams in our Solution Park. Once you download our application with extension of hundreds of design elements you’ll find it simple to start using it straight away and you’ll be pleasantly surprised of how smart this tool for making the charts is. Try it today for saving your time sake not to look for something else once you have great chance to use this excellent product already now!
Flowchart Definition
Representing some kind of process, system, algorithm or some problem’s solution showing it as structured scheme is always better in a was of flowchart which allows to follow the logic operations happened, in order to illustrate it. Creating such flowchart we can see the way this system or process can be improved. Also it allows to find the key elements of system and to edit them the way they have to look like in the end. Looking for the final solution, it is necessary to structure the basic information and to make this data work the way it can pleases you. There are many different flowcharts well known and available nowadays in ConceptDraw STORE as there are lots of stencil libraries, samples and templates which can be helpful in using the ConceptDraw DIAGRAM while creating any kind of chart you need. High-Level Flowchart, Deployment or Matrix Flowchart as well as Detailed one is not a comprehensive list of existing flowcharts and you have this chance today to make your own professional chart using our software.
Data Modeling with Entity Relationship Diagram
Data Modeling with Entity Relationship Diagram
 Jackson Structured Programming (JSP) Diagram Solution
The powerful abilities of this solution make the ConceptDraw DIAGRAM ideal
assistant in structured programming and Jackson systems design, and other
technical, on the EE2. sad Software Analysis & Design website of the University
of Surrey. Besides, there are two types of employees at this company - those
who
- 4 Level pyramid model diagram - Information systems types ...
- Types of Flowcharts | Structured Systems Analysis and Design ...
- Data Flow Diagram Symbols. DFD Library | Types of Flowcharts ...
- Systems development life cycle | SSADM Diagram | Process ...
- Process Flowchart | Types of Flowcharts | Database Flowchart ...
- Pyramid Structure In System Analysis And Design
- System Analysis And Design Flowchart Symbols
- Disadvantages Of System Analysis And Design
- Information Oriented System Flowchart In Sad
- JSD - Jackson system development | What Are Advantages Of ...