Process Flowchart


Organizational Chart Template

Onion Diagram Maker

Stakeholder Onion Diagrams

 Stakeholder Onion Diagrams
The Stakeholder Onion Diagram is often used as a way to view the relationships of stakeholders to a project goal. A basic Onion Diagram contains a rich information. It shows significance of stakeholders that will have has influence to the success achieve
 Basic Pie Charts
This solution extends the capabilities of ConceptDraw PRO v10.3.0 (or later) with templates, samples, and a library of vector stencils for drawing pie and donut charts.
 Pie Charts
Pie Charts are extensively used in statistics and business for explaining data and work results, in mass media for comparison (i.e. to visualize the percentage for the parts of one total), and in many other fields. The Pie Charts solution for ConceptDraw PRO v10 offers powerful drawing tools, varied templates, samples, and a library of vector stencils for simple construction and design of Pie Charts, Donut Chart, and Pie Graph Worksheets.
 Divided Bar Diagrams
The Divided Bar Diagrams Solution extends the capabilities of ConceptDraw PRO v10 with templates, samples, and a library of vector stencils for drawing high impact and professional Divided Bar Diagrams and Graphs, Bar Diagram Math, and Stacked Graph.
 Interactive Voice Response Diagrams
Interactive Voice Response Diagrams solution extends ConceptDraw PRO v10 software with samples, templates and libraries of ready-to-use vector stencils that help create Interactive Voice Response (IVR) diagrams illustrating in details a work of interactive voice response system, the IVR system’s logical and physical structure, Voice-over-Internet Protocol (VoIP) diagrams, and Action VoIP diagrams with representing voice actions on them, to visualize how the computers interact with callers through voice recognition and dual-tone multi-frequency signaling (DTMF) keypad inputs.
 Business Package for Management
Package intended for professional who designing and documenting business processes, preparing business reports, plan projects and manage projects, manage organizational changes, prepare operational instructions, supervising specific department of an organization, workout customer service processes and prepare trainings for customer service personal, carry out a variety of duties to organize business workflow.
 Seating Plans
The correct and convenient arrangement of tables, chairs and other furniture in auditoriums, theaters, cinemas, banquet halls, restaurants, and many other premises and buildings which accommodate large quantity of people, has great value and in many cases requires drawing detailed plans. The Seating Plans Solution is specially developed for their easy construction.
 Target and Circular Diagrams
This solution extends ConceptDraw PRO software with samples, templates and library of design elements for drawing the Target and Circular Diagrams.
 SWOT and TOWS Matrix Diagrams
SWOT and TOWS Matrix Diagrams solution extends ConceptDraw PRO and ConceptDraw MINDMAP software with features, templates, samples and libraries of vector stencils for drawing SWOT and TOWS analysis matrices and mind maps.
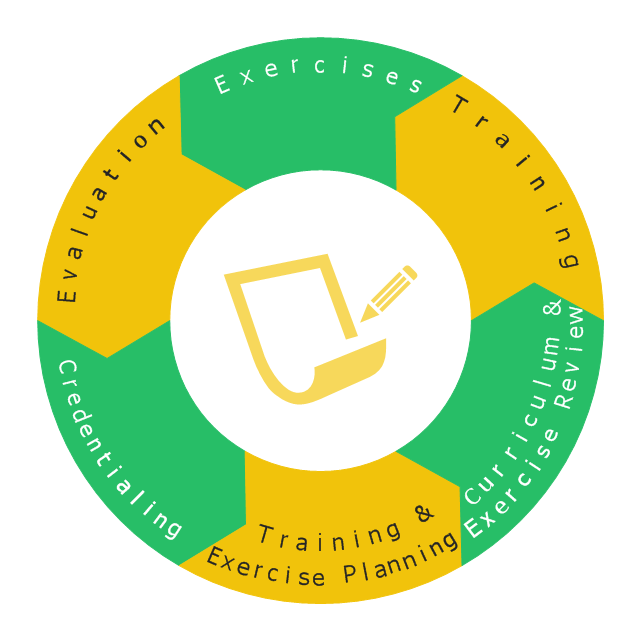
This wheel diagram sample illustrates the emergency preparedness training and exercise processes. It was designed on the base of the diagram on the webpage "Public Health Preparedness Training and Exercise" from the FloridaHealth website of the Florida Department of Health. [floridahealth.gov/ programs-and-services/ emergency-preparedness-and-response/ training-exercise/ ]
"Emergency Preparedness is the discipline of dealing with and avoiding both natural and manmade disasters. It involves mitigation, preparedness, response and recovery in order to lessen the impact of disasters. Emergency management requires a partnership among all levels of government (local, State, and Federal) and the private sector (business and industry, voluntary organizations, and the public). Successful preparedness requires detailed planning and cooperation among each sector." [Emergency Preparedness. Wikipedia]
The arrow donut chart example "Training and exercise process wheel" was created using the ConceptDraw PRO diagramming and vector drawing software extended with the Circular Arrows Diagrams solution from the area "What is a Diagram" of ConceptDraw Solution Park.
Circular arrows diagram
Used Solutions
Pie Chart Word Template. Pie Chart Examples

- How to Draw an Organization Chart | Organizational Structure | How ...
- Draw An Organisational Chart Of Health Sector
- Involvement matrix - SEPP program roles and responsibilities ...
- Risk diagram - Chronic Illness Management Program (CIMP ...
- Draw The Organisation Chart Of A Small Large And Medium
- Probability Quality Control Tools | Prioritization matrix - Health care ...
- Quality function deployment chart - Handheld projector | Quality ...
- Bar Chart Template for Word | Organizational Chart Templates ...
- Health Software Sample
- Typical Drawing Of Small Medium And Large Organizational Chart
- Atmosphere air composition | Percentage Pie Chart . Pie Chart ...
- Geo Map - United States of America Map | US incarceration timeline ...
- Relations diagram - Health care | Prioritization matrix - Health care ...
- Process Flowchart | Basic Audit Flowchart. Flowchart Examples ...
- Bar Diagrams for Problem Solving. Create economics and financial ...
- Human Resource Development | Human Resource Management ...
- Circle Diagrams | What Is a Circle Spoke Diagram | Pie Chart ...
- Information Flow
- Chart Donut State