Structured Systems Analysis and Design Method (SSADM) with ConceptDraw DIAGRAM

 Business Diagrams
The Business Diagrams Solution extends ConceptDraw DIAGRAM v12 with an extensive collection of professionally designed illustrative samples and a wide variety of vector stencils libraries, which are the real help for all business-related people, business analysts, business managers, business advisers, marketing experts, PR managers, knowledge workers, scientists, and other stakeholders allowing them to design the bright, neat, expressive and attractive Bubble Diagrams, Circle-Spoke Diagrams, Circular Arrows Diagrams, and Venn Diagrams with different quantity of sets in just minutes; and then successfully use them in documents, reports, statistical summaries, and presentations of any style.
Booch OOD Diagram

Flowchart Components

DFD Library System

UML Activity Diagram

Functional Flow Block Diagram

Types of Flowcharts


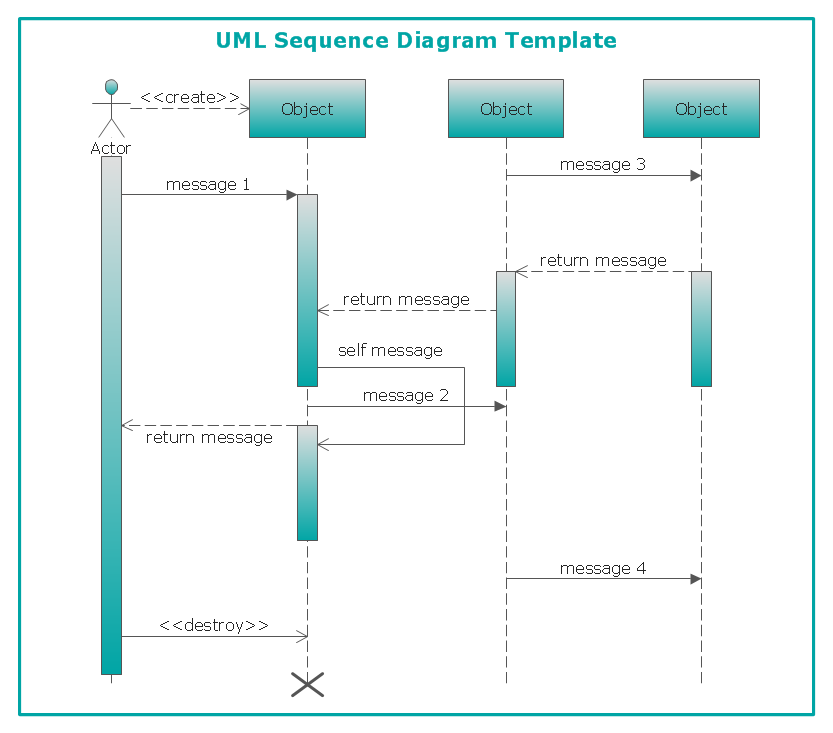
UML Sequence Diagram

Data Flow Diagram (DFD)

- Systems development life cycle | SSADM Diagram | Process ...
- Systems development life cycle
- With The Aid Of Diagram Describe System Development Life Cycle
- Model development life cycle - IDEF0 diagram | Circular Arrows ...
- Draw A Diagram To Show How Different Stages A System ...
- Diagram Of Life Cycle
- Water cycle diagram | Strategic planning - Cycle diagram | Strategic ...
- Product life cycle process - Flowchart | With The Aid Of Diagram ...
- Proton-proton chain reaction diagram | BPR Diagram . Business ...
- Flow Diagram Steps Of Implemanting Mis