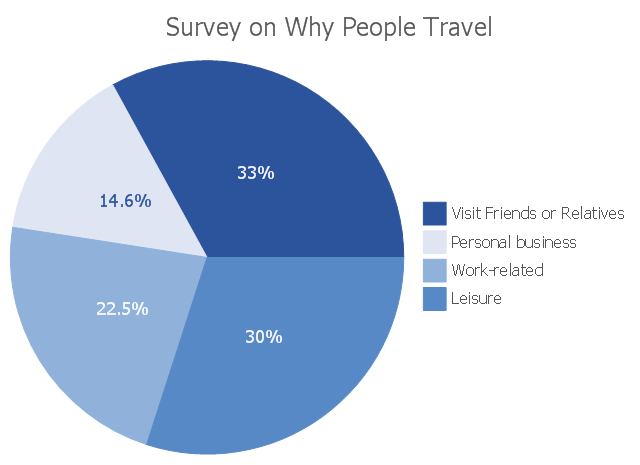
This pie chart sample shows the results of survey on Why People Travel. It was designed on the base of the Wikimedia Commons file: Pie chart.jpeg. [commons.wikimedia.org/ wiki/ File:Pie_ chart.jpeg]
"Travel is the movement of people between relatively distant geographical locations, and can involve travel by foot, bicycle, automobile, train, boat, airplane, or other means, with or without luggage, and can be one way or round trip. Travel can also include relatively short stays between successive movements." [Travel. Wikipedia]
The pie chart example "Survey on Why People Travel" was created using ConceptDraw PRO software extended with the Pie Charts solution from the Statistical Charts and Diagrams area of ConceptDraw Solution Park.
Pie chart
Design Pictorial Infographics. Design Infographics

Travel Infographics

Pictorial Chart

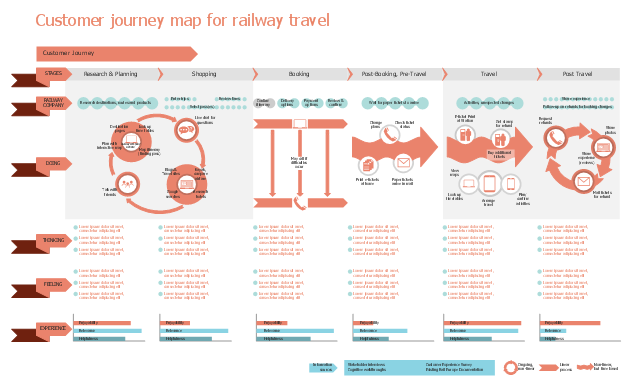
This customer experience map template was designd on the base of Wikimedia Commons file SD053- Figure 5.14 (8462249080).jpg. [commons.wikimedia.org/ wiki/ File:SD053-_ Figure_ 5.14_ (8462249080).jpg]
This file is licensed under the Creative Commons Attribution 2.0 Generic license. [creativecommons.org/ licenses/ by/ 2.0/ deed.en]
Use this CJM template for customer journey mapping with ConceptDraw DIAGRAM software.
"The customer journey map for service design was first introduced through the Acela high-speed rail project of IDEO (1999). It has subsequently become one of the most widely used tools for service design and have been utilized as a tool for visualizing intangible services." [Customer experience. Wikipedia]
"Service design is the activity of planning and organizing people, infrastructure, communication and material components of a service in order to improve its quality and the interaction between the service provider and its customers. Service design may function as a way to inform changes to an existing service or create a new service entirely." [Service design. Wikipedia]
The customer journey map template "Railway travel CJM" is included in Customer Journey Mapping solution from Marketing area of ConceptDraw Solution Park.
Marketing diagram
Transportation Infographics
Infographic Maker

How to Draw Pictorial Chart. How to Use Infograms

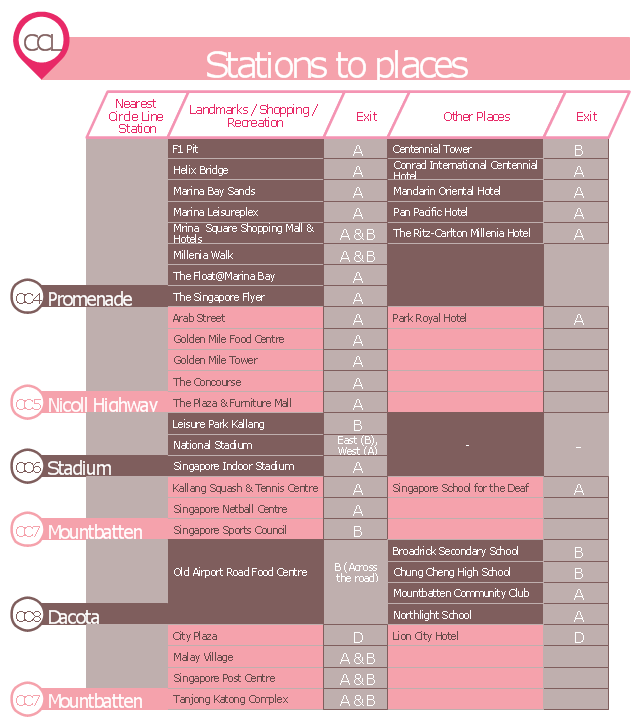
This typography infographics example was redesigned from the Wikimedia Commons file: CCLStationstoplaces.jpg. [commons.wikimedia.org/ wiki/ File:CCLStationstoplaces.jpg]
This file is licensed under the Creative Commons Attribution-Share Alike 3.0 Unported license. [creativecommons.org/ licenses/ by-sa/ 3.0/ deed.en]
"The Circle Line (CCL) is Singapore's fourth Mass Rapid Transit line. This underground line is 35.7 kilometres (22.2 mi) long with 31 stations (excluding Bukit Brown) and is fully automatically operated. It takes about one hour to travel from one end to the other. The line is coloured orange in the rail map.
As the name implies, the line is an orbital circle route linking all radial routes leading to the city. It also covers many parts of the Central Area. From Promenade, the line branches with one branch terminating at Dhoby Ghaut and the other terminating at Marina Bay. Transfers to the North South Line are provided at Bishan, Dhoby Ghaut and Marina Bay, East West Line at Paya Lebar and Buona Vista, and North East Line at Dhoby Ghaut, Serangoon and HarbourFront. The Downtown Line interchanges with the Circle Line at Bayfront and Promenade and future sections of the Downtown Line will interchange at Botanic Gardens and MacPherson. The future Thomson Line will interchange with the Circle Line at Caldecott and Marina Bay.
The Circle Line is the first medium capacity line in Singapore. As a medium capacity line, each Circle Line train has only three cars instead of the six-car configuration as seen on current MRT lines. Half a million people are expected to use the Circle Line each day. The line reduces travelling time for commuters by allowing them to shorten trips between north to east or north to west and vice versa, bypassing busy interchange like City Hall and Raffles Place." [Circle MRT Line. Wikipedia]
The example "CCL Stations to places - Infographics" was created using the ConceptDraw PRO diagramming and vector drawing software extended with the Typography Infographics solition from the area "What is infographics" in ConceptDraw Solution Park.
Infographics
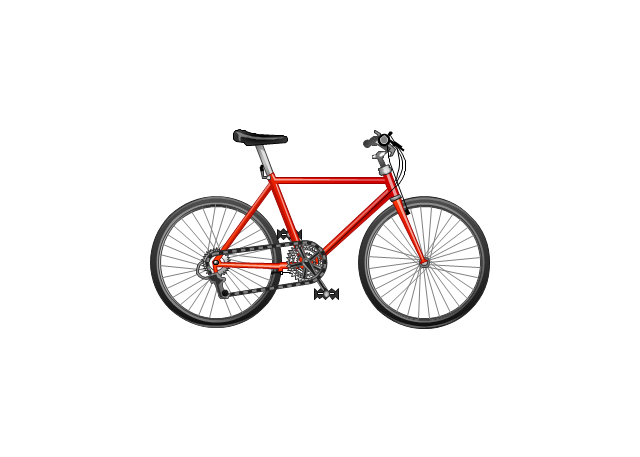
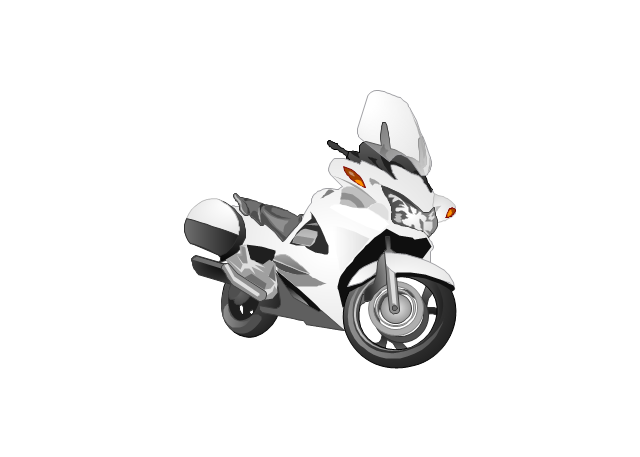
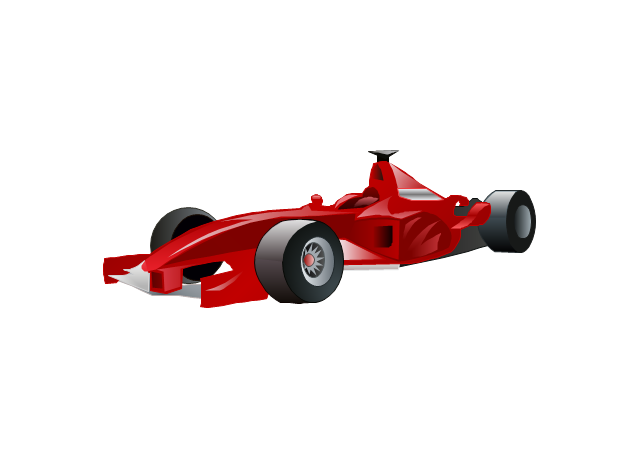
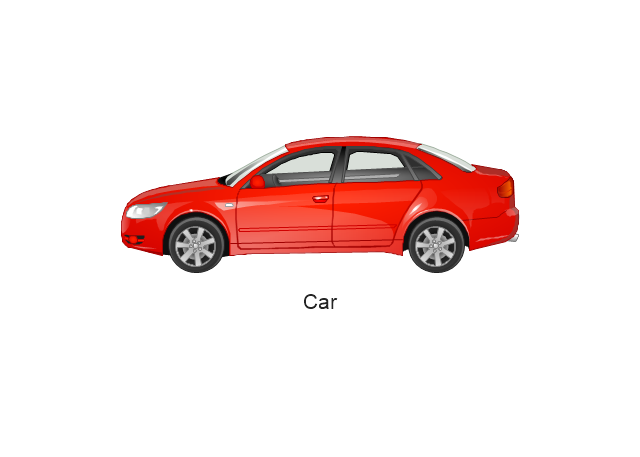
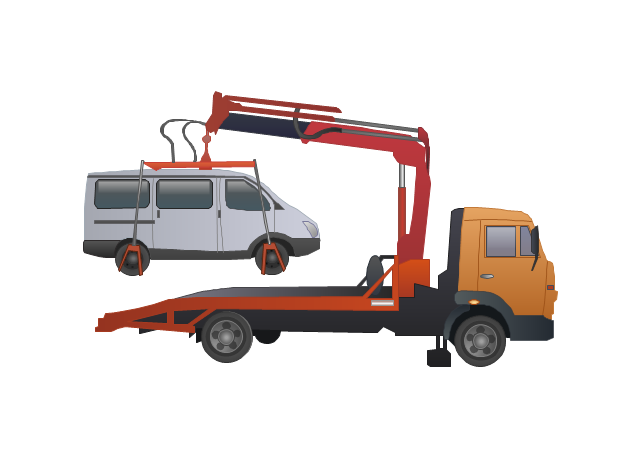
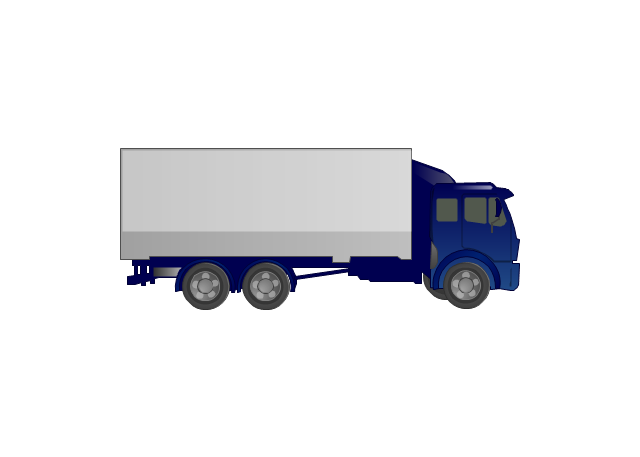
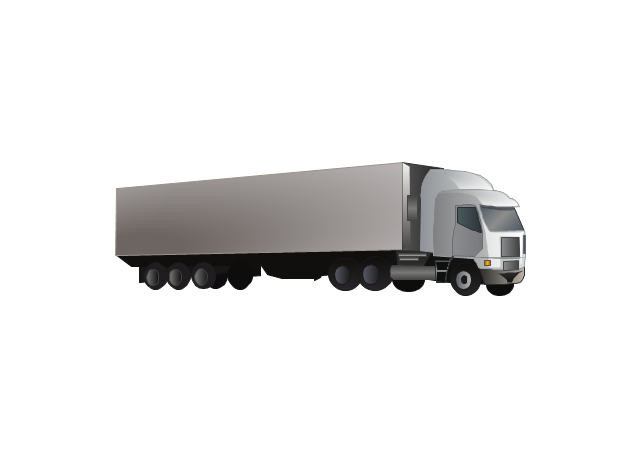
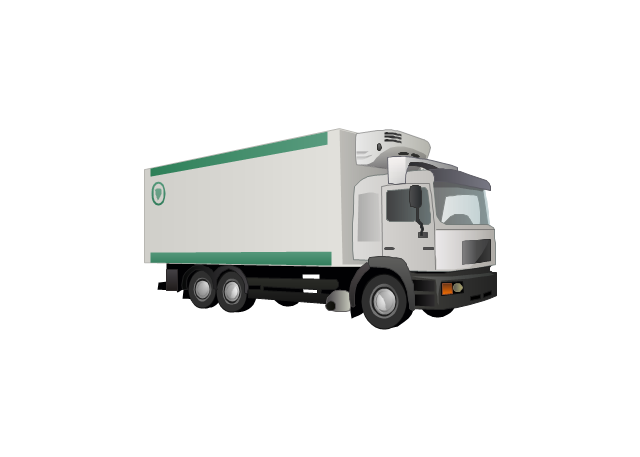
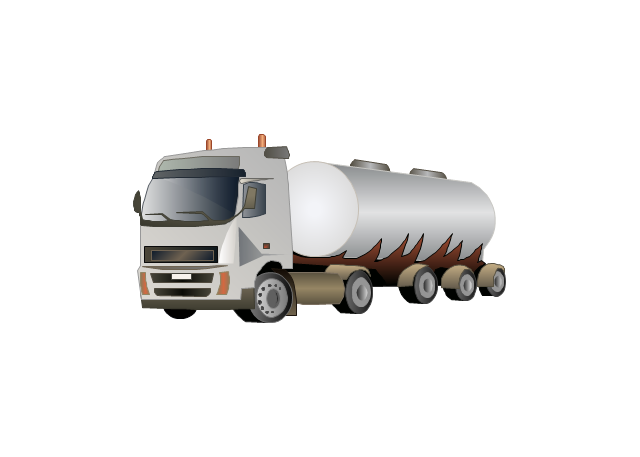
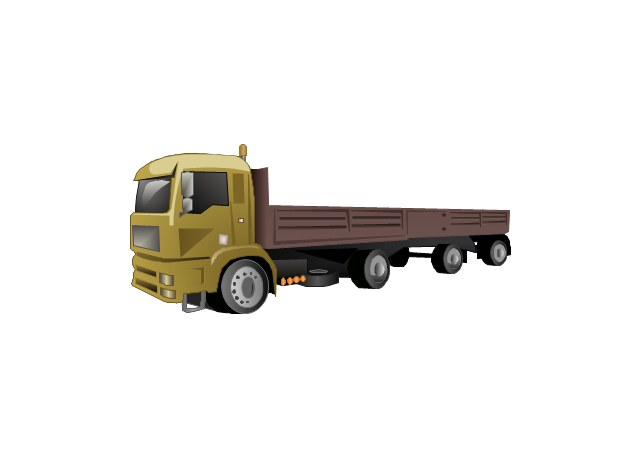
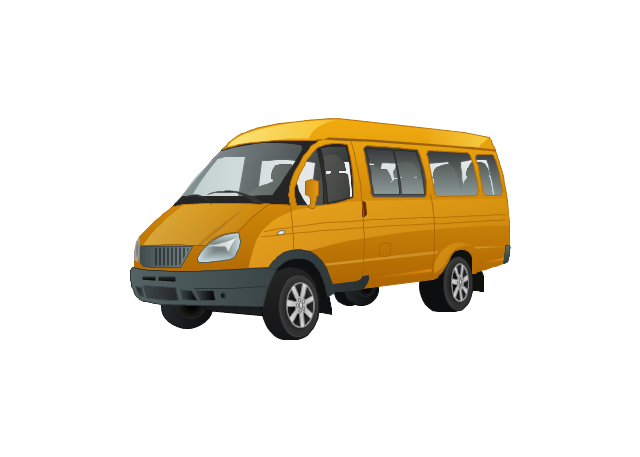
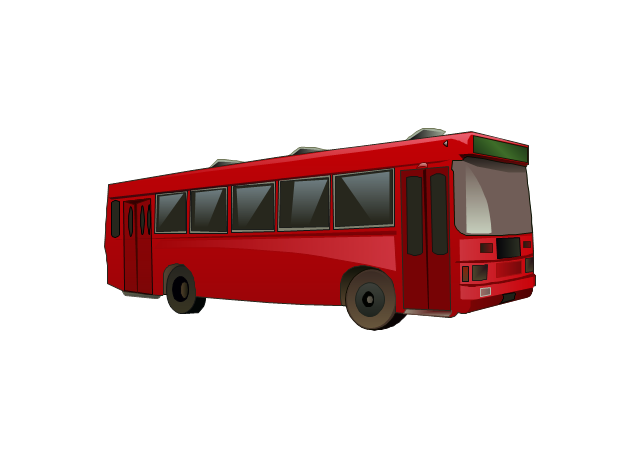
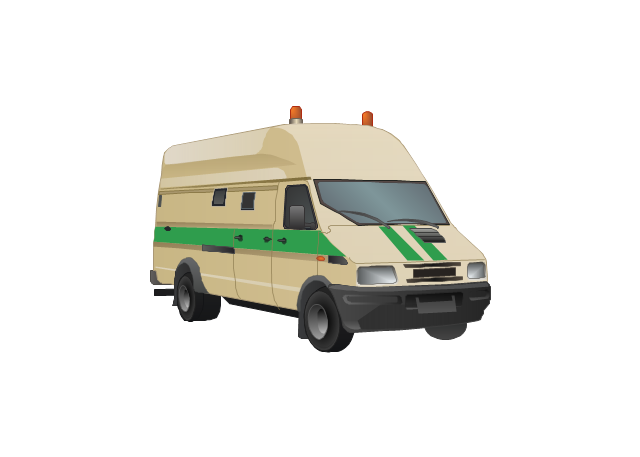
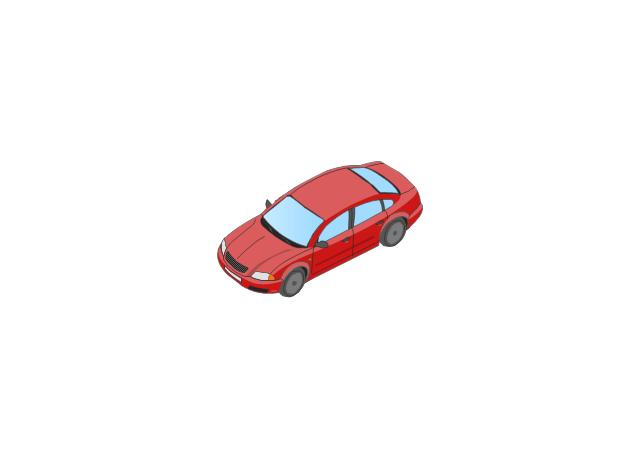
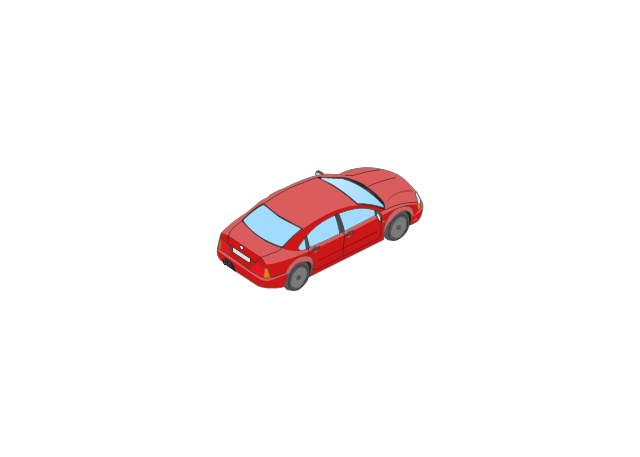
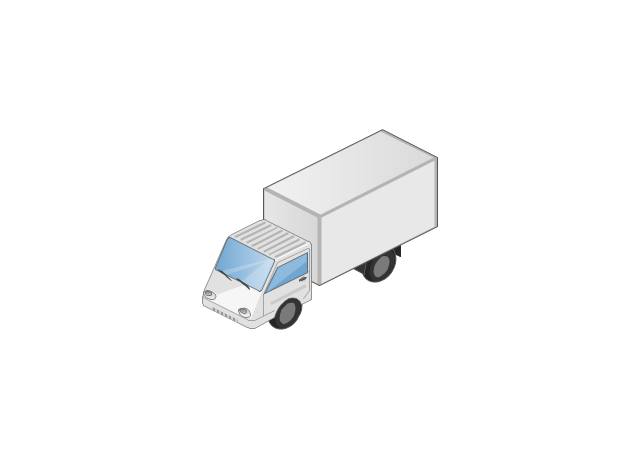
The vector stencils library "Road transport" contains 43 clip art images for creating vehicles and transportation illustrations, presentation slides, infographics and webpages using the ConceptDraw PRO diagramming and vector drawing software.
"Road transport (British English) or road transportation (American English) is the transport of passengers or goods on roads. ...
Transportation.
Transport on roads can be roughly grouped into the transportation of goods and transportation of people. In many countries licencing requirements and safety regulations ensure a separation of the two industries.
The nature of road transportation of goods depends, apart from the degree of development of the local infrastructure, on the distance the goods are transported by road, the weight and volume of the individual shipment, and the type of goods transported. For short distances and light, small shipments a van or pickup truck may be used. For large shipments even if less than a full truckload a truck is more appropriate. In some countries cargo is transported by road in horse-drawn carriages, donkey carts or other non-motorized mode. Delivery services are sometimes considered a separate category from cargo transport. In many places fast food is transported on roads by various types of vehicles. For inner city delivery of small packages and documents bike couriers are quite common.
People are transported on roads either in individual cars or automobiles, or in mass transit by bus or coach. Special modes of individual transport by road like rickshaws or velotaxis may also be locally available." [Road transport. Wikipedia]
The vector stencils library "Road transport" is included in the Aerospace and Transport solution from the Illustrations area of ConceptDraw Solution Park.
www.conceptdraw.com/ solution-park/ illustrations-aerospace-transport
Bicycle
Motorcycle
Race car
Car
Taxi
Sedan
Hatchback
Estate car
4x4
Limousine
Police car

Ambulance
Fire apparatus
Wrecker
Semi truck

Truck
Trailer
Refrigeration Truck
Petrol Tanker
Truck
Minibus
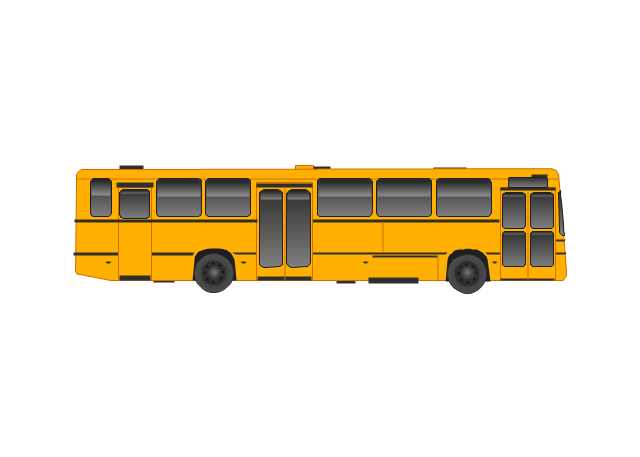
City Bus
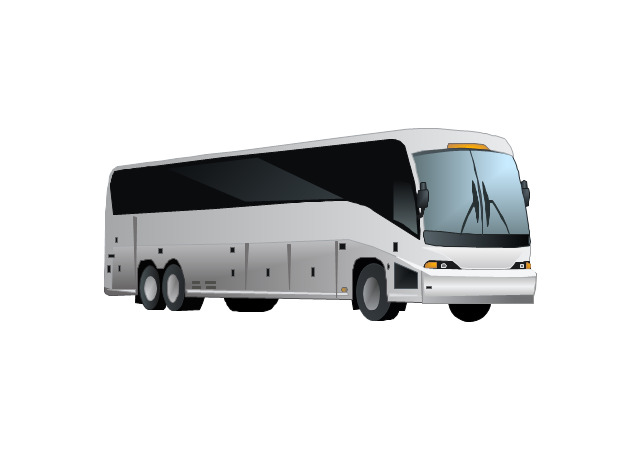
Bus
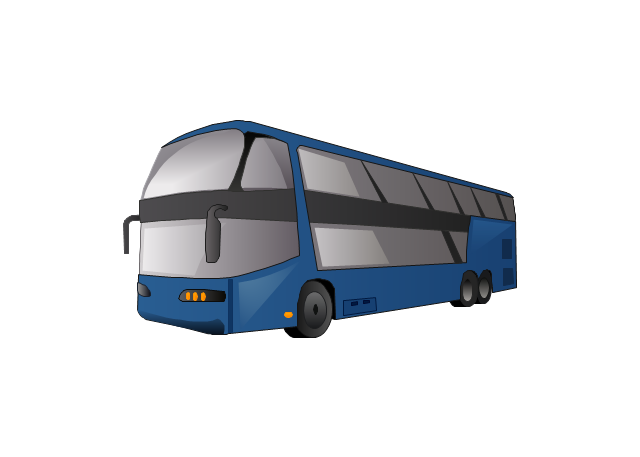
Sightseeing Bus
Double-decker Bus
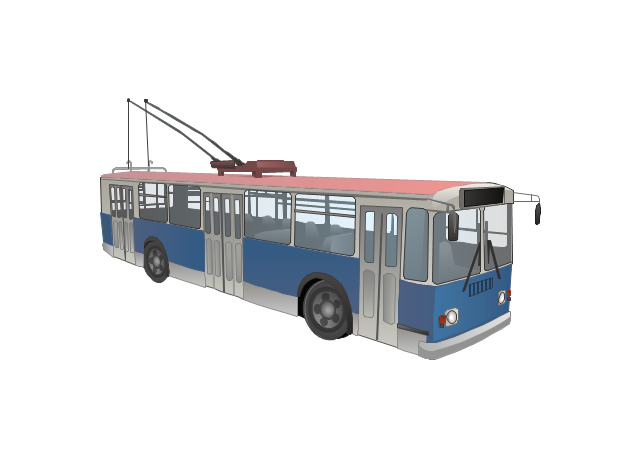
Trolleybus
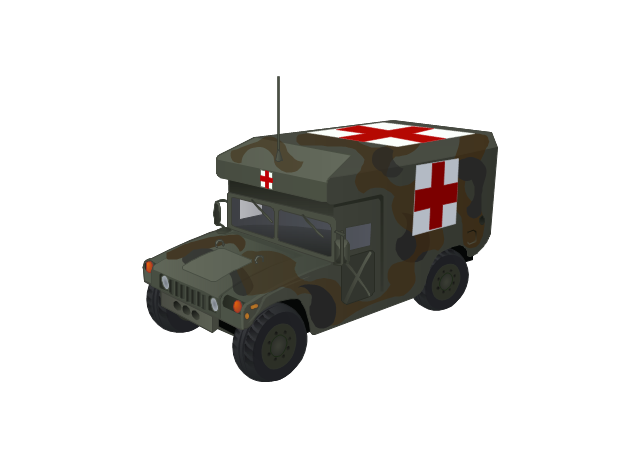
Military Ambulance
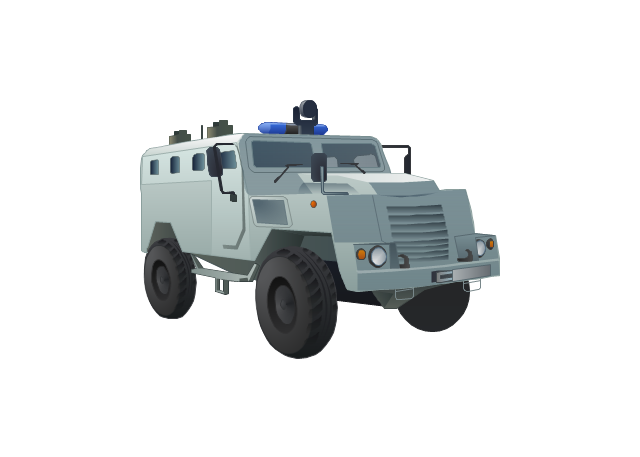
Armored police vehicle
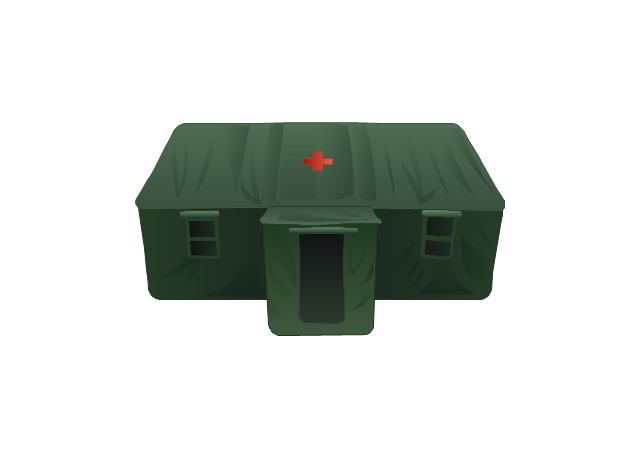
First Aid Tent
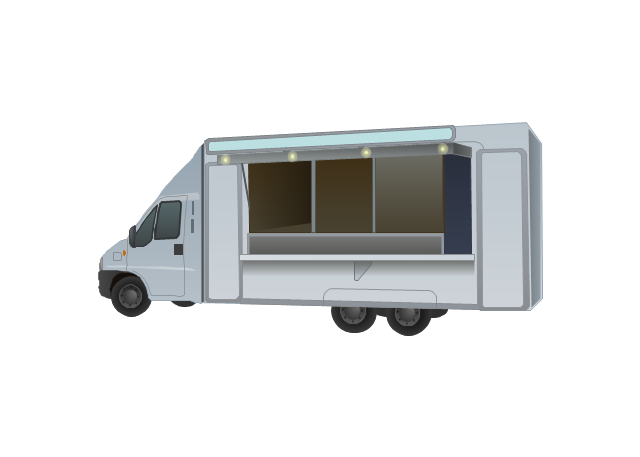
Catering Vehicle
Semi-trailer
Fuel Tank
Fire Station
Signal Light
Walkie-Talkie
Lorry
B-Train
Taxi
Armored cash transport car
Car isometric
Car isometric
Box truck isometric
Bus isometric
- Travel and tourism pictograms - Vector stencils library | Education ...
- Design elements - Travel and tourism pictograms | Travel and ...
- Travel and tourism pictograms - Vector stencils library | Specification ...
- Travel and tourism pictograms - Vector stencils library | Travelling ...
- Er Diagram For Travel Management System
- Travel Infographics | How to Create a Powerful Infographic When ...
- Travel
- Cisco Network Diagram Software | Travel Infographics | Excellent ...
- Data Flow Diagram Of Travel Management System
- Dfd Of Tour And Travel Management System