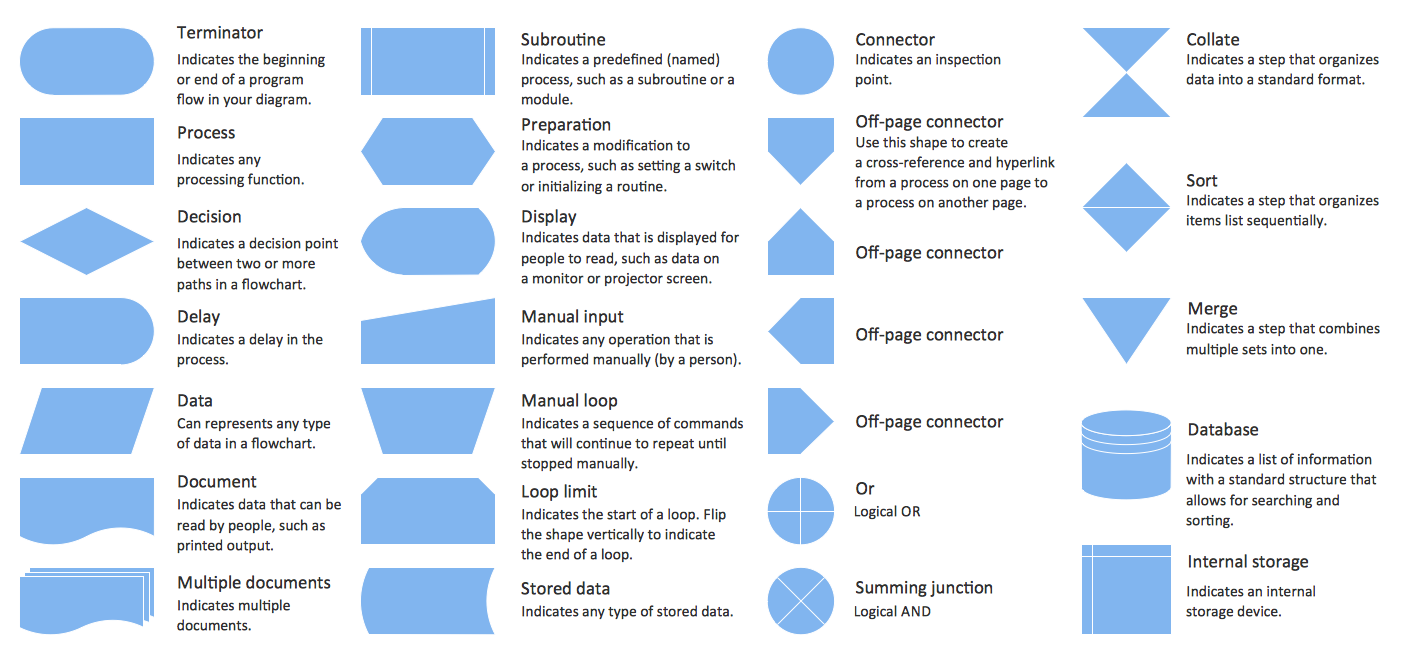
Flowchart design. Flowchart symbols, shapes, stencils and icons

Entity Relationship Diagram Symbols

Pyramid Diagram

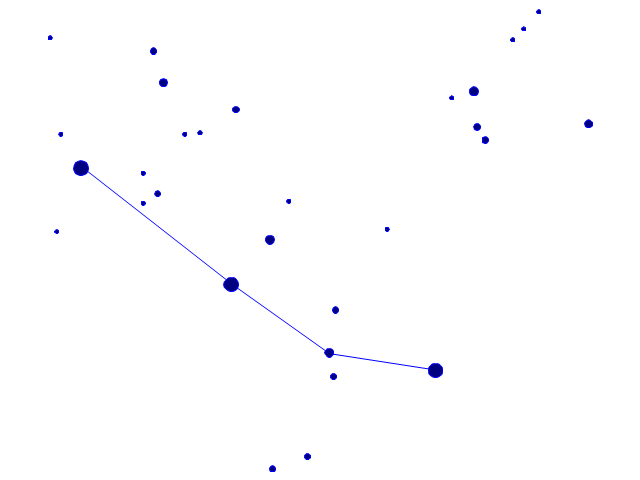
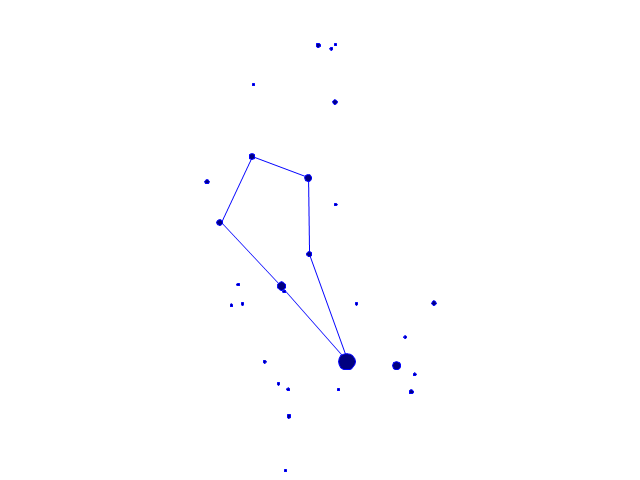
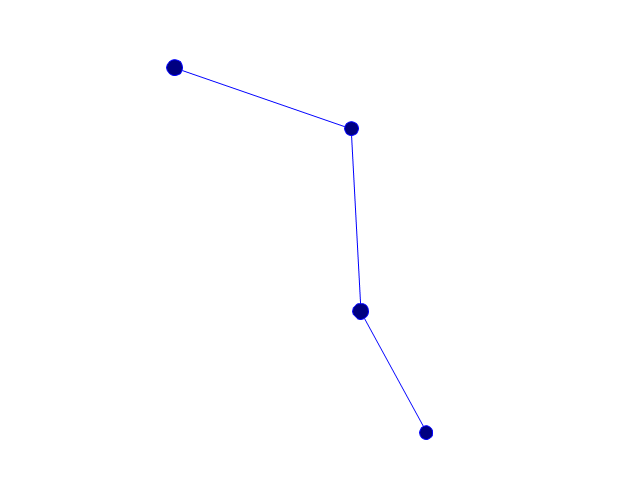
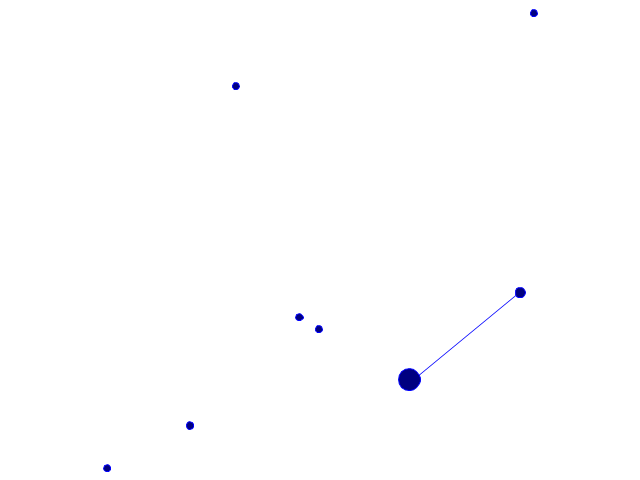
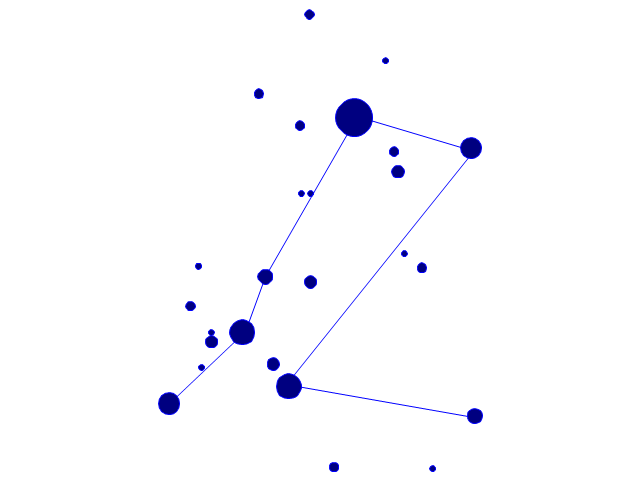
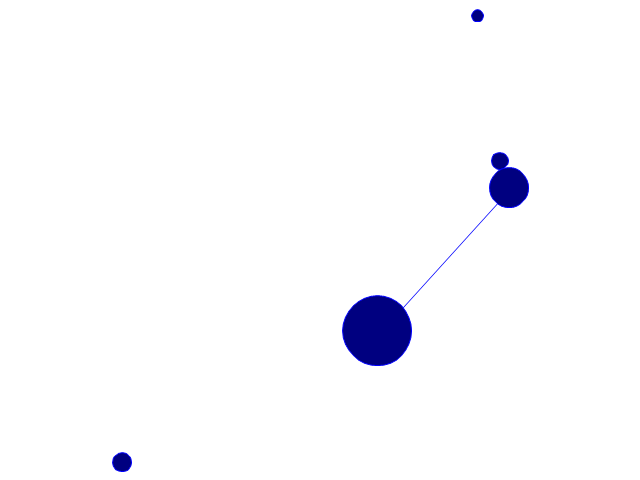
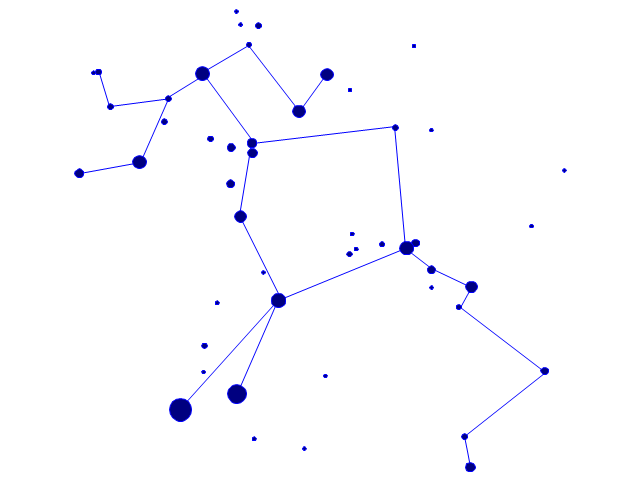
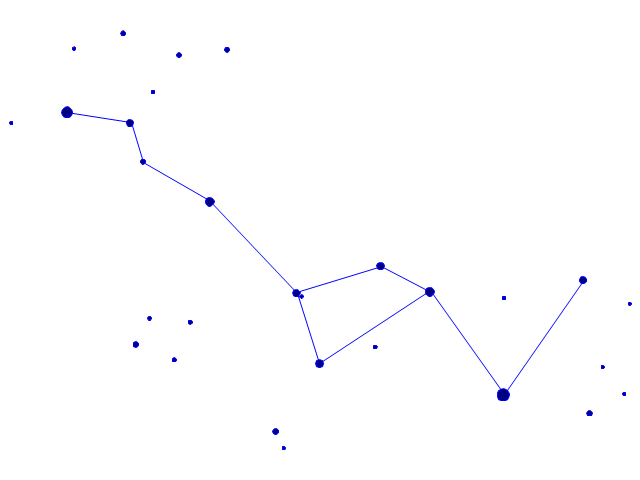
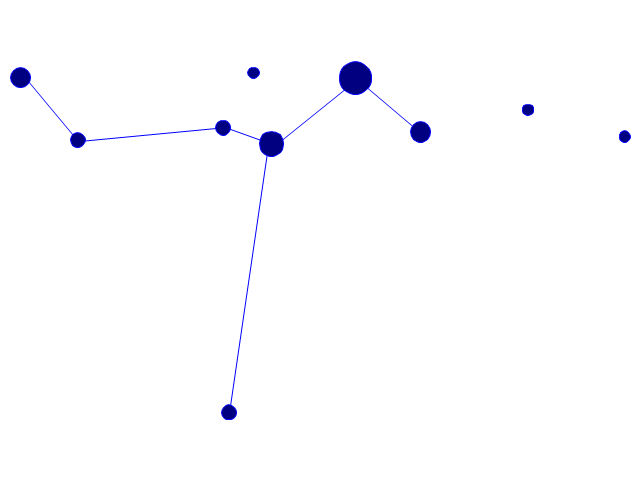
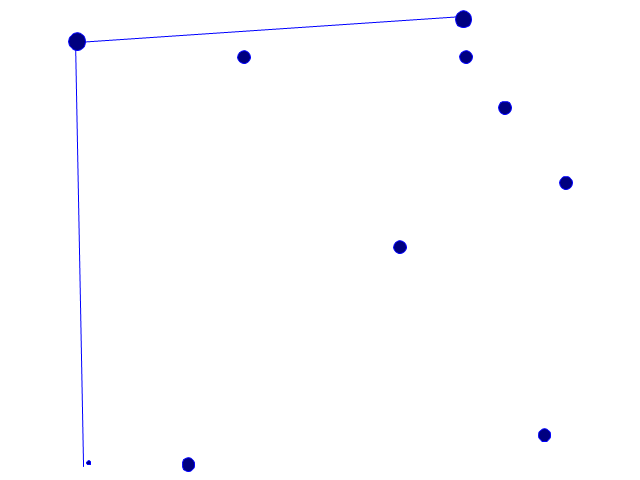
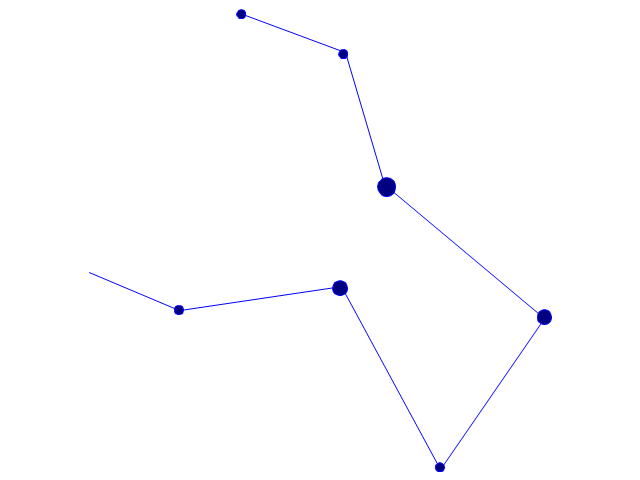
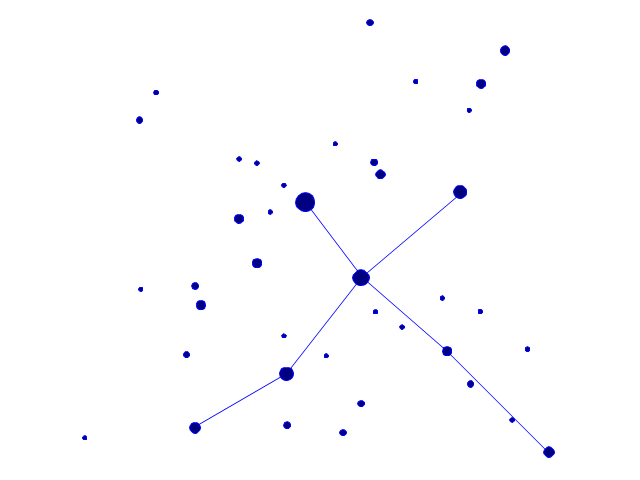
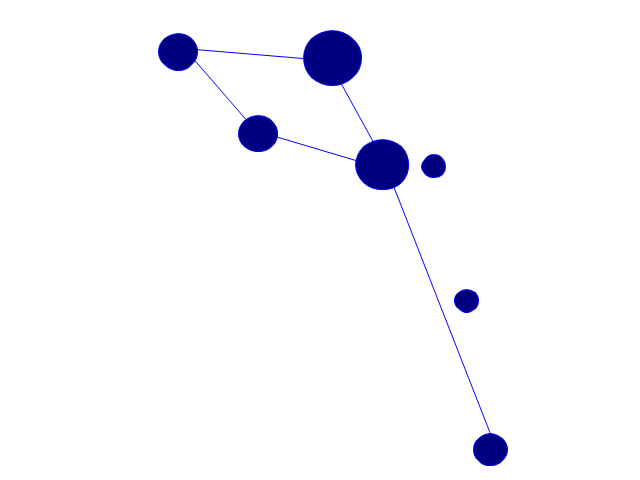
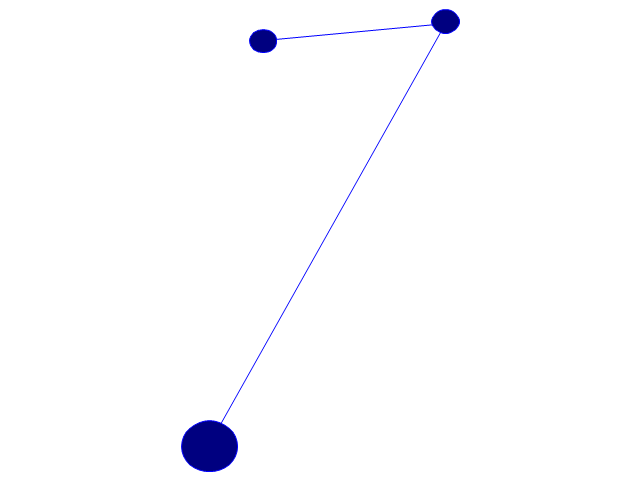
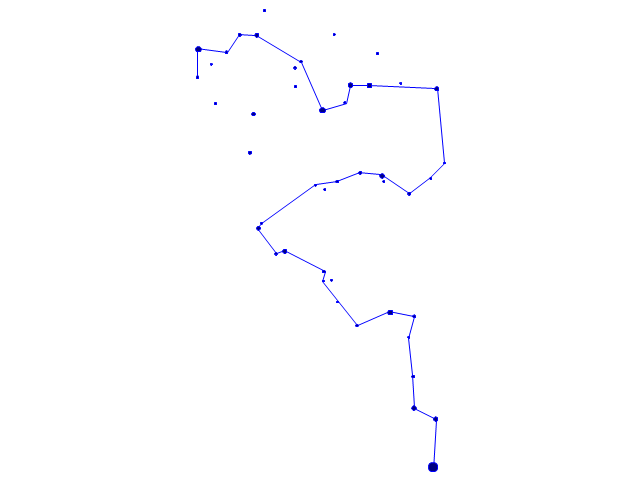
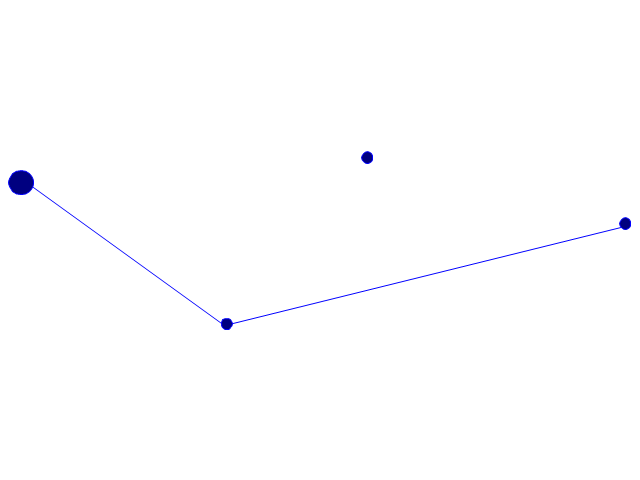
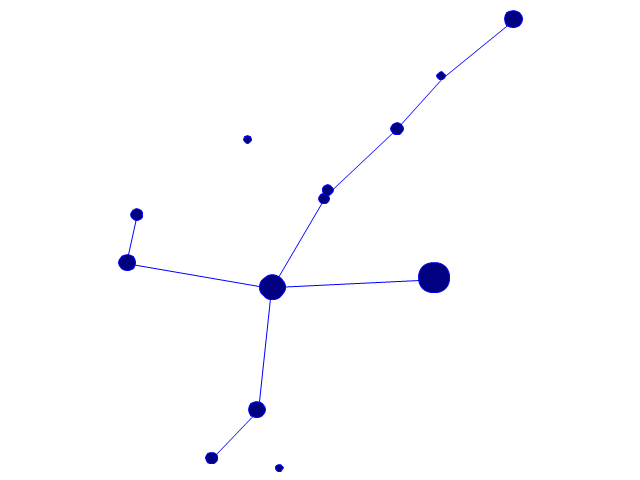
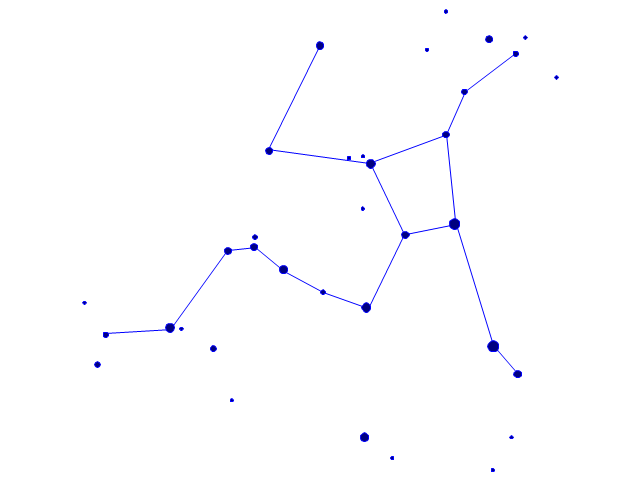
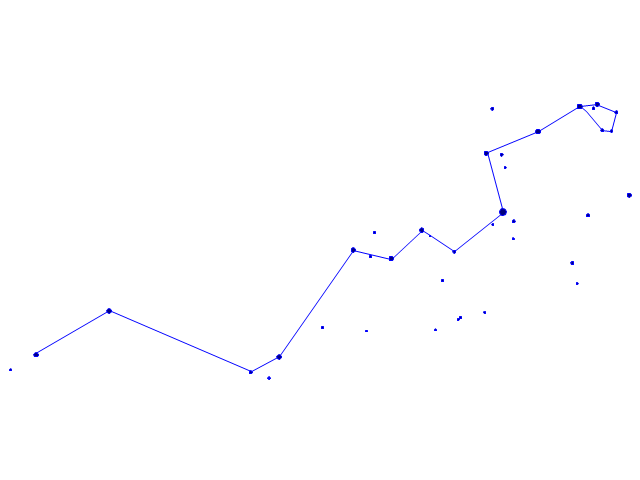
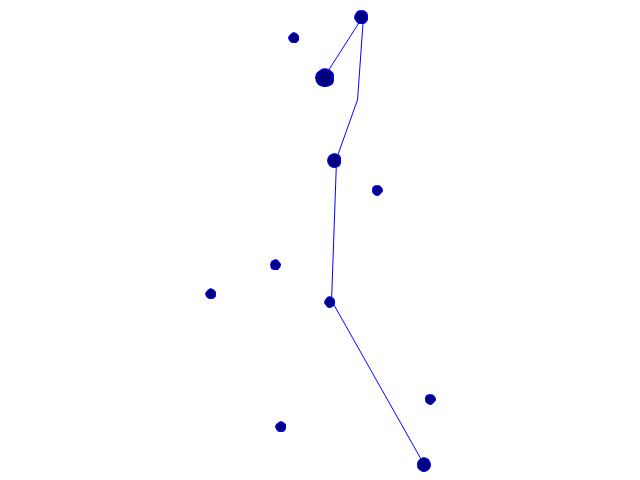
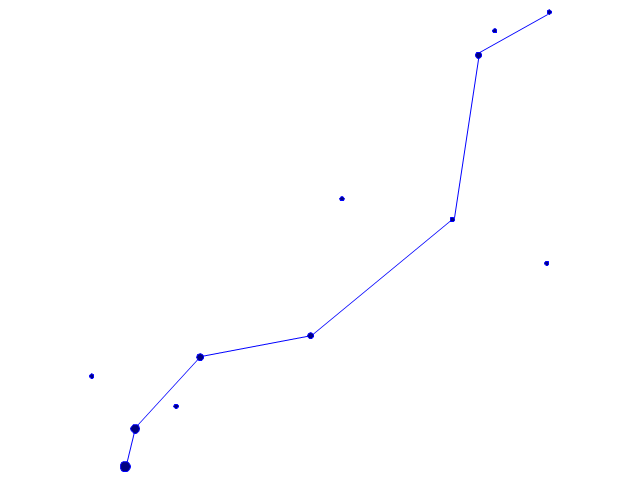
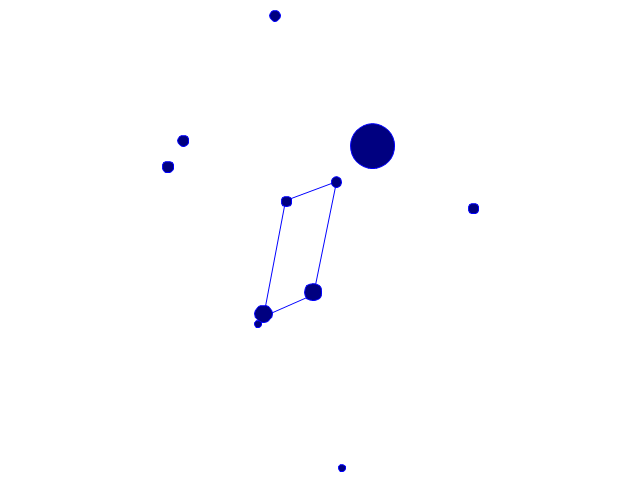
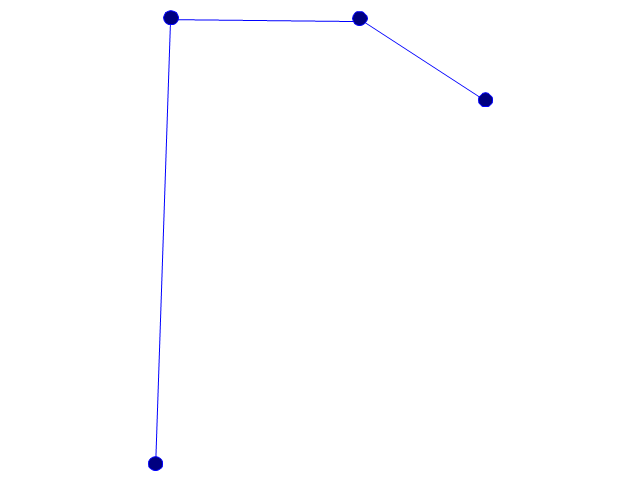
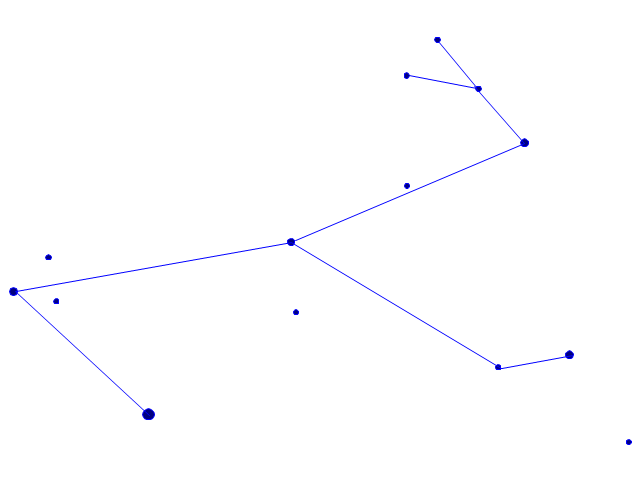
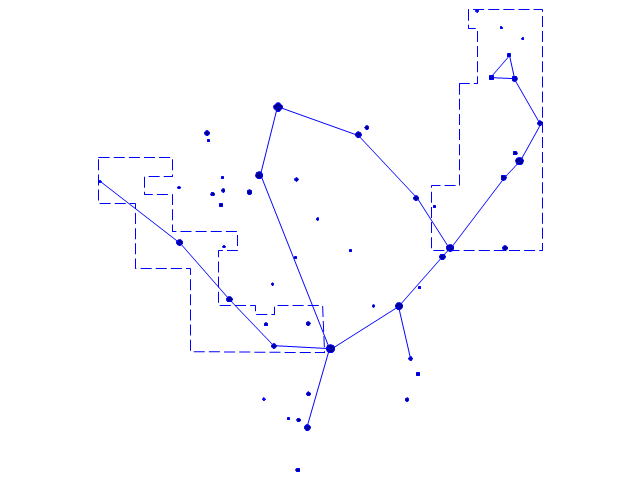
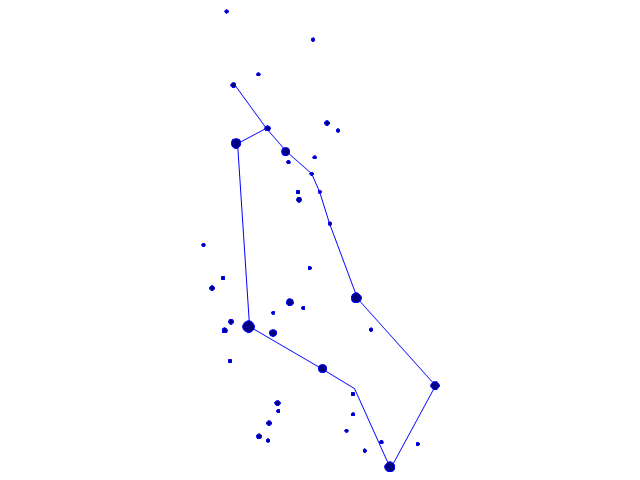
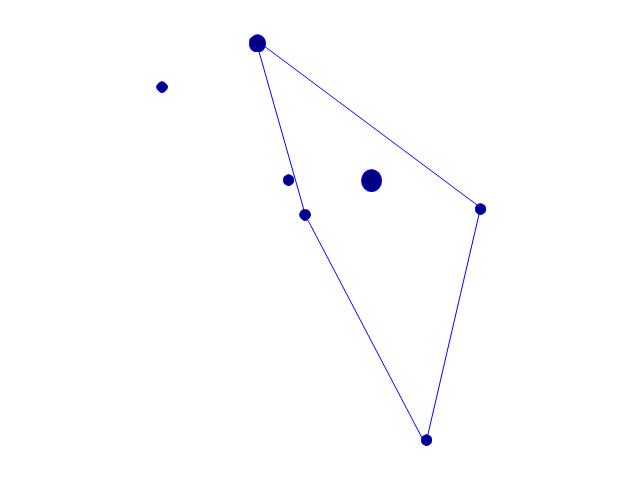
The vector stencils library "Constellations except Zodiac, Northern and Southern" contains 47 star constellation maps of all constellations except Zodiac, Northern (45-90 degrees) and Southern (45-90 degrees).
Use these shapes for drawing astronomical diagrams and illustrations in ConceptDraw PRO diagramming and vector drawing software extended with the Astronomy solution from the Science and Education area in ConceptDraw Solution Park.
Use these shapes for drawing astronomical diagrams and illustrations in ConceptDraw PRO diagramming and vector drawing software extended with the Astronomy solution from the Science and Education area in ConceptDraw Solution Park.
Andromeda
Antlia
Aquila
Auriga

Bootes
Caelum
Canes Venatici
Canis Major
Canis Minor
Centaurus
Cetus
Columba
Coma Berenices
Corona Australis
Corona Borealis
Corvus
Crater
Cygnus
Delphinus
Equuleus
Eridanus
Fornax
Grus
Hercules
Hydra
Lacerta
Leo Minor

Lepus
Lupus
Lynx
Lyra
Microscopium
Monoceros
Ophiuchus and Serpens
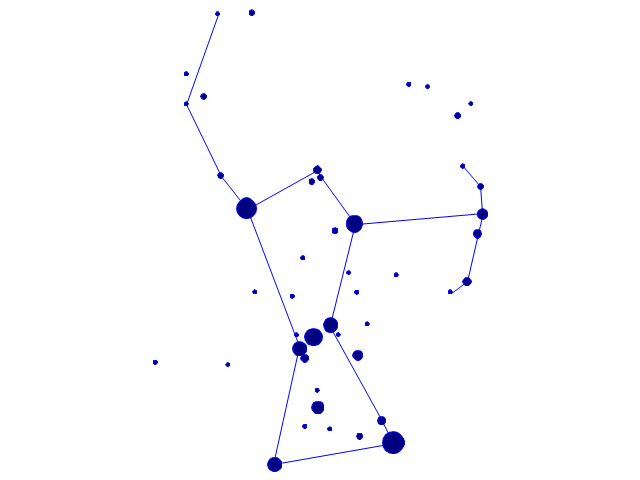
Orion
Pegasus

Perseus
Piscis Austrinus
Puppis
Pyxis
Sagitta
Sculptor
Scutum
Sextans
Triangulum
Vela
Vulpecula
ERD Symbols and Meanings


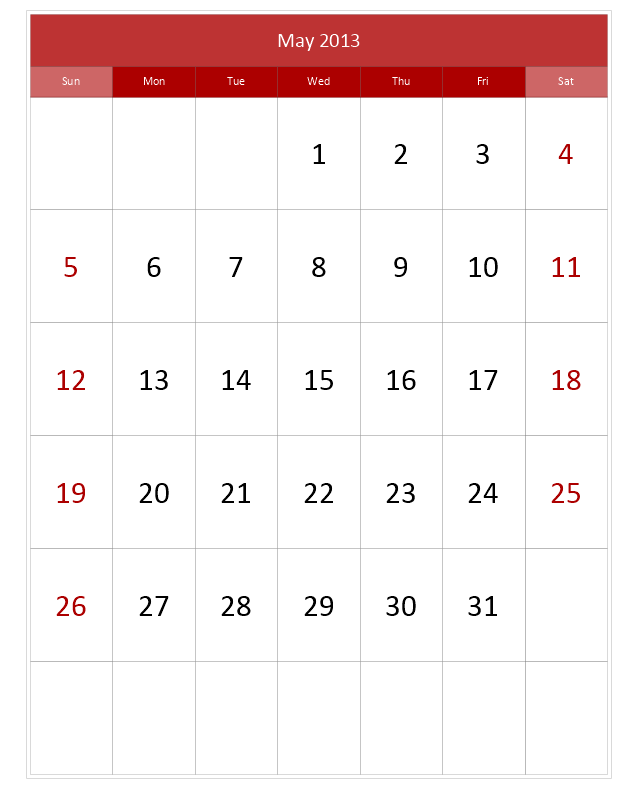
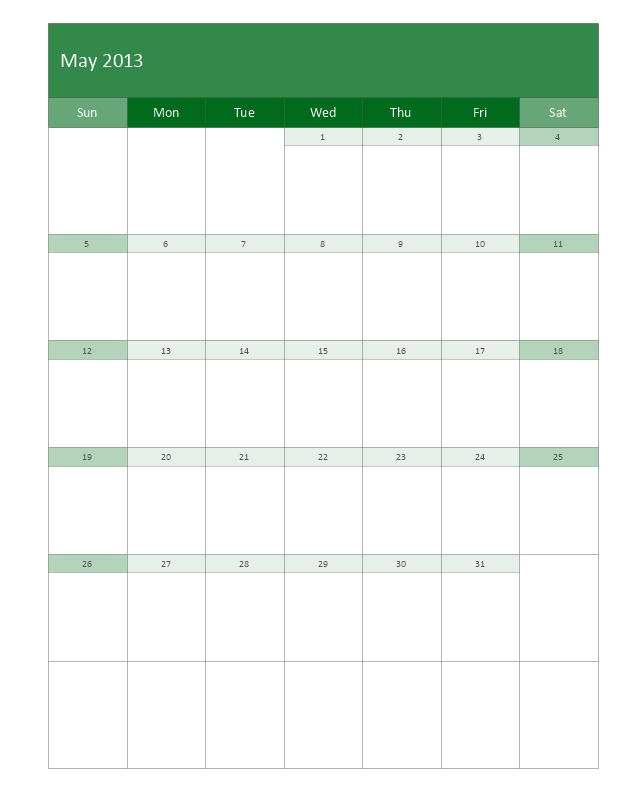
The vector stencils library "Calendars" contains 44 shapes of month calendars, marker icons and symbols for schedules, and clocks. Use it to create your calendars in the ConceptDraw PRO diagramming and vector drawing software extended with the Calendars solution from the Management area of ConceptDraw Solution Park.
Small Calendar (White, Rounded)
-calendars---vector-stencils-library.png--diagram-flowchart-example.png)
Small Calendar (White)
-calendars---vector-stencils-library.png--diagram-flowchart-example.png)
Small Calendar (Black, Rounded)
-calendars---vector-stencils-library.png--diagram-flowchart-example.png)
Small Calendar (Black)
-calendars---vector-stencils-library.png--diagram-flowchart-example.png)
Small Calendar (Color, Rounded)
-calendars---vector-stencils-library.png--diagram-flowchart-example.png)
Small Calendar (Color)
-calendars---vector-stencils-library.png--diagram-flowchart-example.png)
Mid Calendar (Rounded)
-calendars---vector-stencils-library.png--diagram-flowchart-example.png)
Mid Calendar
Large Calendar (Picture 1)
-calendars---vector-stencils-library.png--diagram-flowchart-example.png)
Large Calendar (Picture 2)
-calendars---vector-stencils-library.png--diagram-flowchart-example.png)
Large Calendar (Color)
-calendars---vector-stencils-library.png--diagram-flowchart-example.png)
Large Calendar
Large Calendar (Rounded)
-calendars---vector-stencils-library.png--diagram-flowchart-example.png)
Stylish Clocks
Clocks

Clocks
Week (First Letters)
-calendars---vector-stencils-library.png--diagram-flowchart-example.png)
Week
7 days
7 days
Month
Weeks
Quarter
3 Month
Special Day (Circle)
-calendars---vector-stencils-library.png--diagram-flowchart-example.png)
Special Day (Square)
-calendars---vector-stencils-library.png--diagram-flowchart-example.png)
Special Day (Triangle)
-calendars---vector-stencils-library.png--diagram-flowchart-example.png)
Special Day (Star)
-calendars---vector-stencils-library.png--diagram-flowchart-example.png)
Special Day (Cross)
-calendars---vector-stencils-library.png--diagram-flowchart-example.png)
Special Day (Check)
-calendars---vector-stencils-library.png--diagram-flowchart-example.png)
Special Day (Clocks)
-calendars---vector-stencils-library.png--diagram-flowchart-example.png)
Special Day (Note)
-calendars---vector-stencils-library.png--diagram-flowchart-example.png)
Special Day (Lightning)
-calendars---vector-stencils-library.png--diagram-flowchart-example.png)
Special Day (Heart)
-calendars---vector-stencils-library.png--diagram-flowchart-example.png)
:)
-calendars---vector-stencils-library.png--diagram-flowchart-example.png)
:(

Moon phase, new
Moon phase, waxing crescent
Moon phase, 1st quarter
Moon phase, waxing gibbous
Moon phase, full
Moon phase, waning gibbous
Moon phase, 3rd quarter
Moon phase, waning crescent
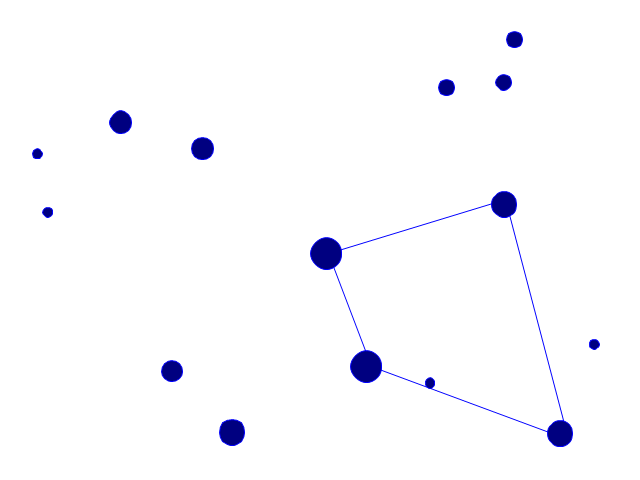
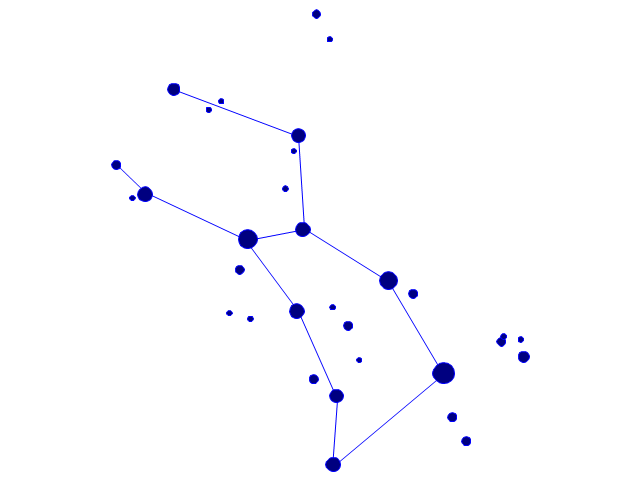
The vector stencils library "Southern constellations" contains 22 icons of Southern constellations maps.
Use these star constellation charts for drawing astronomical diagrams and illustrations in ConceptDraw PRO diagramming and vector drawing software extended with the Astronomy solution from the Science and Education area in ConceptDraw Solution Park.
Use these star constellation charts for drawing astronomical diagrams and illustrations in ConceptDraw PRO diagramming and vector drawing software extended with the Astronomy solution from the Science and Education area in ConceptDraw Solution Park.
Apus
---vector-stencils-library.png--diagram-flowchart-example.png)
Ara
---vector-stencils-library.png--diagram-flowchart-example.png)
Carina
---vector-stencils-library.png--diagram-flowchart-example.png)
Chamaeleon
---vector-stencils-library.png--diagram-flowchart-example.png)
Circinus
---vector-stencils-library.png--diagram-flowchart-example.png)
Crux
---vector-stencils-library.png--diagram-flowchart-example.png)
Dorado
---vector-stencils-library.png--diagram-flowchart-example.png)
Horologium
---vector-stencils-library.png--diagram-flowchart-example.png)
Hydrus
---vector-stencils-library.png--diagram-flowchart-example.png)
Indus
---vector-stencils-library.png--diagram-flowchart-example.png)
Mensa
---vector-stencils-library.png--diagram-flowchart-example.png)
Musca
---vector-stencils-library.png--diagram-flowchart-example.png)
Norma
---vector-stencils-library.png--diagram-flowchart-example.png)
Octans
---vector-stencils-library.png--diagram-flowchart-example.png)
Pavo
---vector-stencils-library.png--diagram-flowchart-example.png)
Phoenix
---vector-stencils-library.png--diagram-flowchart-example.png)
Pictor
---vector-stencils-library.png--diagram-flowchart-example.png)
Reticulum
---vector-stencils-library.png--diagram-flowchart-example.png)
Telescopium
---vector-stencils-library.png--diagram-flowchart-example.png)
Triangulum Australe
---vector-stencils-library.png--diagram-flowchart-example.png)
Tucana
---vector-stencils-library.png--diagram-flowchart-example.png)
Volans
---vector-stencils-library.png--diagram-flowchart-example.png)
Pyramid Diagram

The vector stencils library "European country flags" contains 51 clipart images of Europe state flags.
Use the European country flags clip art to illustrate your business documents, presentation slides, web pages, geo maps and infographics.
The clip art example "European country flags - Vector stencils library" was created using the ConceptDraw PRO diagramming and vector drawing software extended with the Artwork solution from the Illustration area of ConceptDraw Solution Park.
Flag of Europe

Flag of Benelux
Flag of Albania
Flag of Andorra
Flag of Armenia
Flag of Austria

Flag of Azerbaijan
Flag of Belarus

Flag of Belgium
Flag of Bosnia and Herzegovina
Flag of Bulgaria
Flag of Croatia
Flag of Cyprus
Flag of Czech Republic
Flag of Denmark
Flag of Estonia
Flag of Finland
Flag of France
Flag of Georgia
Flag of Germany

Flag of Greece
Flag of Hungary
Flag of Iceland
Flag of Ireland
Flag of Italy
Flag of Kazakhstan

Flag of Latvia

Flag of Liechtenstein

Flag of Lithuania

Flag of Luxembourg

Flag of the Republic of Macedonia
Flag of Malta
Flag of Moldova
Flag of Monaco
Flag of Montenegro
Flag of the Netherlands
Flag of Norway
Flag of Poland
Flag of Portugal
Flag of Romania

Flag of Russia
Flag of San Marino
Flag of Serbia
Flag of Slovakia
Flag of Slovenia
Flag of Spain
Flag of Sweden
Flag of Switzerland

Flag of Turkey
Flag of Ukraine

Flag of the United Kingdom
3 Circle Venn Diagram. Venn Diagram Example
