 Sales Flowcharts
The Sales Flowcharts solution lets you create and display sales process maps, sales process workflows, sales steps, the sales process, and anything else involving sales process management.
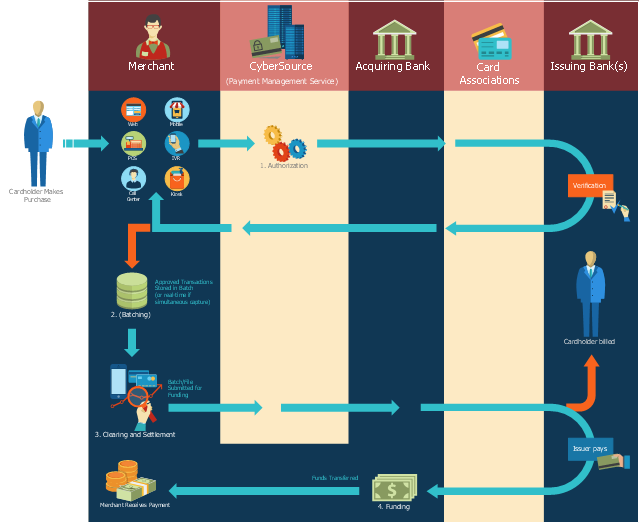
This payment process flowchart example was created on the base of the diagram of payment process using Global Payment Processing Services from the U.S. Securities and Exchange Commission website.
"Global Payment Processing Services. CyberSource Advanced enables merchants to accept payments made by all major credit and debit cards including American Express®, Discover®, Diners Club International®, JCB, MasterCard®, and Visa® cards. Our customers can also accept payment by corporate procurement cards, electronic checks, PayPal® Express Checkout, and the Bill Me Later® service. Merchants that have business models based on subscriptions can utilize the CyberSource recurring billing service with automated account updating services. For merchants selling internationally, we support direct debit, and bank transfers, as well as regional card brands such as Carte Bleue, Carta Si, Dankort, Laser, Solo, and Visa Electron. We provide these services for online, call center, kiosk, integrated voice response (“IVR”), and IP-enabled point of sale (“POS”) transactions."
[www.sec.gov/ Archives/ edgar/ data/ 934280/ 000119312510042764/ d10k.htm]
The flowchart example "Global Payment Solutions" was created using the ConceptDraw PRO diagramming and vector drawing software extended with the Sales Flowcharts solution from the Marketing area of ConceptDraw Solution Park.
Payment process flowchart
Data Flow Diagram

Competitor Analysis

Flowchart Definition

 Data Flow Diagrams (DFD)
Data Flow Diagrams solution extends ConceptDraw DIAGRAM software with templates, samples and libraries of vector stencils for drawing the data flow diagrams (DFD).
IDEF0 Diagram

Examples Flowchart

ConceptDraw DIAGRAM diagramming and vector drawing software provides the unique Flowcharts Solution from the "Diagrams" Area of ConceptDraw Solution Park with variety of vector objects libraries and collection of examples Flowchart. Each example flowchart included in Flowcharts solution is a real help in drawing process, it can be the good base or perfect source of inspiration.
DFD Library System

Why Flowchart Important to Accounting Information System?

- Payment Process Flow Chart Debit Cards
- Global Payment Solutions | Sales Flowcharts | Sales flowchart ...
- Global Payment Solutions | Cross-Functional Flowchart | SWOT and ...
- UML activity diagram - Payment process | ATM UML Diagrams ...
- Global Payment Solutions | Design elements - Sales flowchart ...
- Flow Chart Showing Sales Transactions
- Data Flow Diagram | BPMN 2.0 | Sales Flowcharts | Activity Diagram ...
- Cybersource Payment Flow Chart
- Invoice payment process - Flowchart | Business Process Elements ...
- Global Payment Solutions | UML activity diagram - Payment process ...