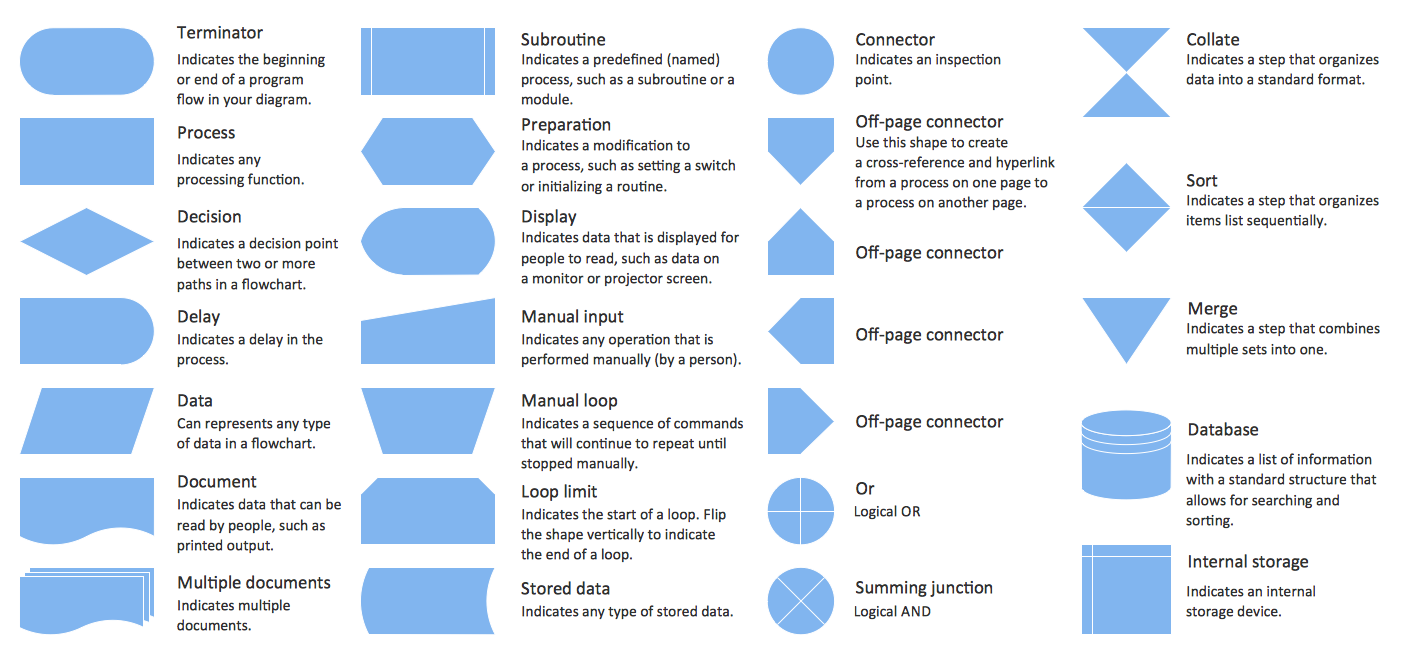
Basic Flowchart Symbols and Meaning


Types of Flowcharts


Flowchart on Bank. Flowchart Examples


"In mathematics, the Euclidean algorithm, or Euclid's algorithm, is a method for computing the greatest common divisor (GCD) of two (usually positive) integers, also known as the greatest common factor (GCF) or highest common factor (HCF). ...
The GCD of two positive integers is the largest integer that divides both of them without leaving a remainder (the GCD of two integers in general is defined in a more subtle way).
In its simplest form, Euclid's algorithm starts with a pair of positive integers, and forms a new pair that consists of the smaller number and the difference between the larger and smaller numbers. The process repeats until the numbers in the pair are equal. That number then is the greatest common divisor of the original pair of integers.
The main principle is that the GCD does not change if the smaller number is subtracted from the larger number. ... Since the larger of the two numbers is reduced, repeating this process gives successively smaller numbers, so this repetition will necessarily stop sooner or later - when the numbers are equal (if the process is attempted once more, one of the numbers will become 0)." [Euclidean algorithm. Wikipedia]
The flowchart example "Euclidean algorithm" was created using the ConceptDraw PRO diagramming and vector drawing software extended with the Mathematics solution from the Science and Education area of ConceptDraw Solution Park.
Euclid's algorithm flow chart

Flowchart Components

Contoh Flowchart

Flow Chart Symbols

Business process Flow Chart — Event-Driven Process chain (EPC) diagrams

Diagram Flow Chart

Flowchart design. Flowchart symbols, shapes, stencils and icons

- Algorithm Power Function Flow Chart
- Characteristics Of Algorithm And Flowchart
- Algorithm And Flowchart Their Functions And Characteristics
- Power Function Flow Chart
- Alogrithms And Functions Of Algorithms Flow Chart And Symbols In
- Algorithm And Flowchart Of Structure With Function
- Main Characteristic Of Algorithms And Flowchart
- Whats The Characteristics Of Algorithm And Flowchart
- Example Problem Statement For Algorithm And Flowchart
- Flowchart And Algorithm To Check Mathematical Function