 Comparison Dashboard
Comparison dashboard solution extends ConceptDraw DIAGRAM software with samples, templates and vector stencils library with charts and indicators for drawing the visual dashboard comparing data.
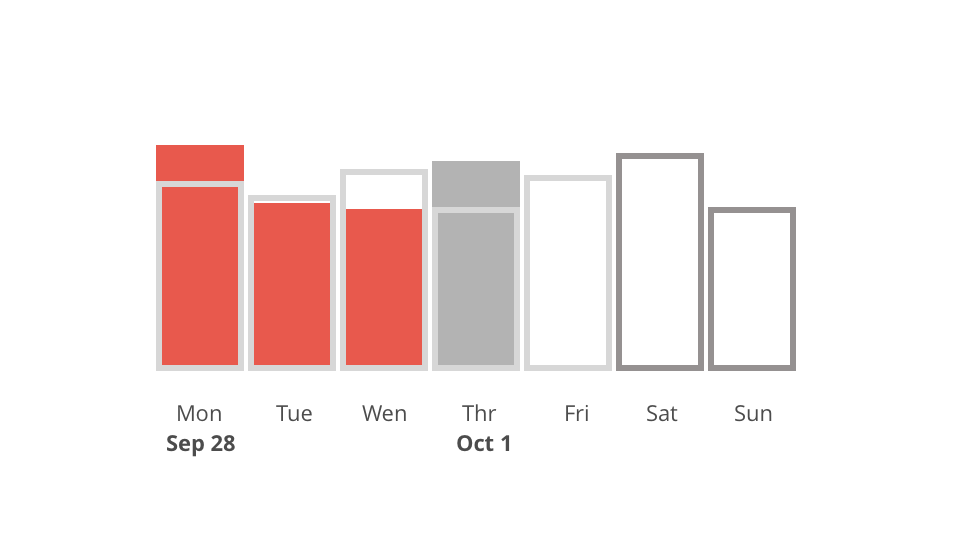
Dashboards. Time Scale. Part I
 Sales Dashboard
Sales Dashboard solution extends ConceptDraw DIAGRAM software with templates, samples and library of vector stencils for drawing the visual dashboards of sale metrics and key performance indicators (KPI).
"Dashboards can be broken down according to role and are either strategic, analytical, operational, or informational. Strategic dashboards support managers at any level in an organization, and provide the quick overview that decision makers need to monitor the health and opportunities of the business. Dashboards of this type focus on high level measures of performance, and forecasts. Strategic dashboards benefit from static snapshots of data (daily, weekly, monthly, and quarterly) that are not constantly changing from one moment to the next. Dashboards for analytical purposes often include more context, comparisons, and history, along with subtler performance evaluators. Analytical dashboards typically support interactions with the data, such as drilling down into the underlying details. Dashboards for monitoring operations are often designed differently from those that support strategic decision making or data analysis and often require monitoring of activities and events that are constantly changing and might require attention and response at a moment's notice." [Dashboard (business). Wikipedia]
The business performance digital dashboard template "Time series dashboard" for the ConceptDraw PRO diagramming and vector drawing software is included in the Time Series Dashboard solution from the area "What is a Dashboard" of ConceptDraw Solution Park.
The business performance digital dashboard template "Time series dashboard" for the ConceptDraw PRO diagramming and vector drawing software is included in the Time Series Dashboard solution from the area "What is a Dashboard" of ConceptDraw Solution Park.
Time series dashboard - Template
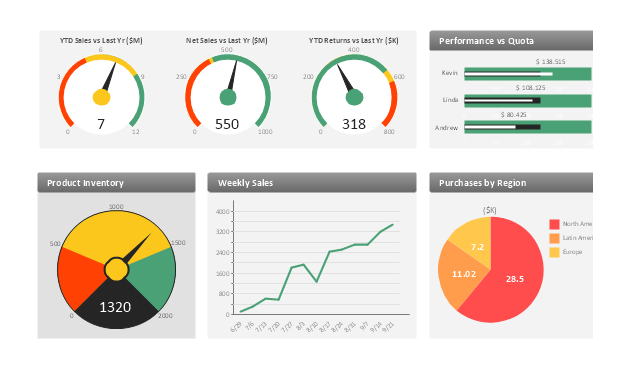
This sales manager dashboard example includes KPIs graphic indicators and business metrics charts: gauge (speedometer) indicators - "YTD Sales vs. Last Year", "Net Sales vs. Last Year", "YTD Returns vs. Last Year", "Product Inventory", bullet indicators - "Performance vs. Quota", line chart - "Weekly Sales", pie chart - "Purchases by Region".
The performance dashboard example "Sales manager dashboard" was created using the ConceptDraw PRO diagramming and vector drawing software extended with the Sales Dashboard solution from the Marketing area of ConceptDraw Solution Park.
www.conceptdraw.com/ solution-park/ marketing-sales-dashboard
The performance dashboard example "Sales manager dashboard" was created using the ConceptDraw PRO diagramming and vector drawing software extended with the Sales Dashboard solution from the Marketing area of ConceptDraw Solution Park.
www.conceptdraw.com/ solution-park/ marketing-sales-dashboard
Sales dashboard
KPI Dashboard

Dashboard

 Logistic Dashboard
The powerful tools of Logistic Dashboard solution and specially developed live graphic objects of logistic icons, logistic navigation elements, logistic indicators, logistic charts and logistic maps effectively assist in designing Logistic dashboards, Logistic maps, Logistic charts, diagrams and infographics. The included set of prebuilt samples and quick-start templates, demonstrates the power of ConceptDraw DIAGRAM software in logistics management, its assisting abilities in development, realization and analyzing the logistic processes, as well as in perfection the methods of logistics management.
Visualize Sales Data Using Sample Data

Reporting & Data Visualization

- Weekly Dashboard Template
- Order Dashboard
- Logistic Dashboard | ConceptDraw PRO Compatibility with MS Visio ...
- Sales Dashboard | Sales manager dashboard | Comparison ...
- Sales dashboard - Vector stencils library | Sales metrics and KPIs ...
- Sales metrics and KPIs - Visual dashboard | Sales dashboard ...
- Meter indicators 2 - Vector stencils library | Sales dashboard - Vector ...
- Sales Dashboard Template | Business Intelligence Dashboard ...
- KPI Dashboard | Enterprise dashboard | Composition Dashboard ...
- Enterprise dashboard | KPI Dashboard | HR Flowcharts | Human ...