 Sales Dashboard
Sales Dashboard solution extends ConceptDraw PRO software with templates, samples and library of vector stencils for drawing the visual dashboards of sale metrics and key performance indicators (KPI).
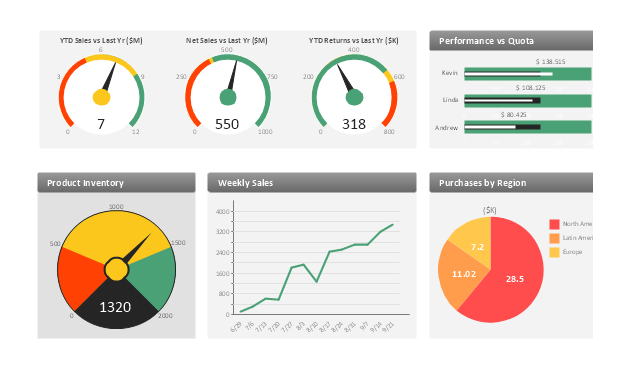
This sales manager dashboard example includes KPIs graphic indicators and business metrics charts: gauge (speedometer) indicators - "YTD Sales vs. Last Year", "Net Sales vs. Last Year", "YTD Returns vs. Last Year", "Product Inventory", bullet indicators - "Performance vs. Quota", line chart - "Weekly Sales", pie chart - "Purchases by Region".
The performance dashboard example "Sales manager dashboard" was created using the ConceptDraw PRO diagramming and vector drawing software extended with the Sales Dashboard solution from the Marketing area of ConceptDraw Solution Park.
www.conceptdraw.com/ solution-park/ marketing-sales-dashboard
The performance dashboard example "Sales manager dashboard" was created using the ConceptDraw PRO diagramming and vector drawing software extended with the Sales Dashboard solution from the Marketing area of ConceptDraw Solution Park.
www.conceptdraw.com/ solution-park/ marketing-sales-dashboard
Sales dashboard
 Comparison Dashboard
Comparison dashboard solution extends ConceptDraw PRO software with samples, templates and vector stencils library with charts and indicators for drawing the visual dashboard comparing data.
Constant improvement of key performance indicators

Performance Indicators

Sales Performance

A KPI Dashboard Provides the Answers Your Sales Team

What is a KPI?

This example was created on the base of the Georgia DOT Performance Management Dashboard from the Georgia Department of Transportation website.
[dot.ga.gov/ informationcenter/ statistics/ performance/ Pages/ default.aspx]
"Performance management (PM) includes activities which ensure that goals are consistently being met in an effective and efficient manner. Performance management can focus on the performance of an organization, a department, employee, or even the processes to build a product of service, as well as many other areas.
PM is also known as a process by which organizations align their resources, systems and employees to strategic objectives and priorities.
Performance management originated as a broad term coined by Dr. Aubrey Daniels in the late 1970s to describe a technology (i.e. science imbedded in applications methods) for managing both behavior and results, two critical elements of what is known as performance. A formal definition of performance management, according to Daniels' is "a scientifically based, data-oriented management system. It consists of three primary elements-measurement, feedback and positive reinforcement."" [Performance management. Wikipedia]
The meter dashboard example "Georgia DOT Performance Management" was created using the ConceptDraw PRO diagramming and vector drawing software extended with the Meter Dashboard solution from the area "What is a Dashboard" of ConceptDraw Solution Park.
Meter dashboard

Sales Dashboard Solutions can help your sales team keep an eye on performance

 Composition Dashboard
Composition dashboard solution extends ConceptDraw PRO software with templates, samples and vector stencils library with charts and indicators for drawing visual dashboards showing data composition.
Sales Dashboard - insight about potential opportunities and key sales operations

 Status Dashboard
Status dashboard solution extends ConceptDraw PRO software with templates, samples and vector stencils libraries with graphic indicators for drawing the visual dashboards showing status data.
Sales Dashboard Examples

- Sales performance dashboard | Sales manager dashboard | Ytd ...
- Sales performance dashboard | Sales Dashboard - Access ...
- Sales performance dashboard | Design elements - Sales KPIs and ...
- Sales metrics and KPIs - Visual dashboard | Sales KPIs ...
- KPIs and Metrics | Sales metrics and KPIs - Visual dashboard | Meter ...
- Orders by months - Time series dashboard
- Performance Indicators | PM Dashboards | Design elements - Sales ...
- Product Comparison Dashboard Template Website
- Performance Indicators | KPI Dashboard | What is a KPI? | Key ...
- What is a KPI? | KPI Dashboard | Performance Indicators | Kpi ...
- Employee distribution - HR dashboard | Frequency Distribution ...
- Cafe performance metrics vs. air temperature - Visual dashboard ...
- Performance Indicators | What is a KPI? | KPI Dashboard | Key ...
- Performance Indicators | KPI Dashboard | Dashboard | Key ...
- Performance Indicators | Sales Dashboard | Constant improvement ...
- Performance Indicators | What is a KPI? | KPI Dashboard | Key ...
- Cafe performance metrics vs. air temperature - Visual dashboard ...
- Sales manager dashboard | ConceptDraw PRO | Inventory ...
- Performance Indicators | What is a KPI? | KPI Dashboard | Key ...
- Performance Indicators | How to Connect Tabular Data (CSV) to a ...