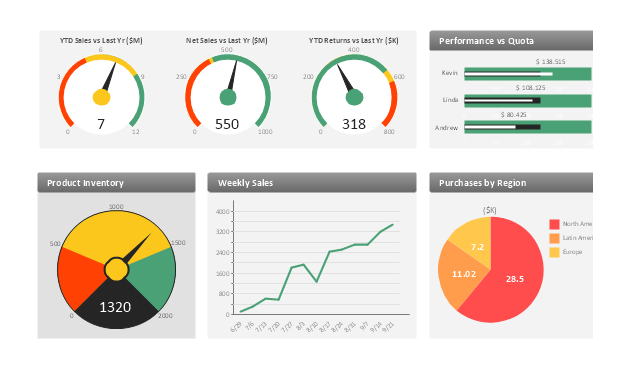
This sales manager dashboard example includes KPIs graphic indicators and business metrics charts: gauge (speedometer) indicators - "YTD Sales vs. Last Year", "Net Sales vs. Last Year", "YTD Returns vs. Last Year", "Product Inventory", bullet indicators - "Performance vs. Quota", line chart - "Weekly Sales", pie chart - "Purchases by Region".
The performance dashboard example "Sales manager dashboard" was created using the ConceptDraw PRO diagramming and vector drawing software extended with the Sales Dashboard solution from the Marketing area of ConceptDraw Solution Park.
www.conceptdraw.com/ solution-park/ marketing-sales-dashboard
The performance dashboard example "Sales manager dashboard" was created using the ConceptDraw PRO diagramming and vector drawing software extended with the Sales Dashboard solution from the Marketing area of ConceptDraw Solution Park.
www.conceptdraw.com/ solution-park/ marketing-sales-dashboard
Sales dashboard
ConceptDraw PRO

- Sales Growth. Bar Graphs Example | Sales Dashboards for Your ...
- Sales Dashboard - Access Anywhere | Dashboard | KPI Dashboard ...
- Performance Indicators | KPI Dashboard | What is a KPI ? | Key ...
- Enterprise dashboard | Meter Dashboard | Website KPIs - Visual ...
- PM Dashboards | How to Create Project Dashboard on Mac | Project ...
- Status Dashboard | Project task status dashboard - Template | PM ...
- Sales Organization | The Facts and KPIs | How to Create a Sales ...
- PM Dashboards | What Information can be Displayed in the ...
- Orders by months - Time series dashboard
- Sales metrics and KPIs - Visual dashboard | Sales dashboard ...
- Dashboard | Status Dashboard | Project task status dashboard ...
- Sales Dashboard Solutions can help your sales team keep an eye ...
- Management indicators - Vector stencils library | Sales performance ...
- How to Track Multiple Licenses in Your Organization | Project tasks ...
- Status Dashboard | PM Dashboards | Meter Dashboard | Free ...
- How to Create Project Dashboard on Mac | Status Dashboard ...
- Gantt Chart Software | Project Management Area | How to Use ...
- How To Create Project Report | Product Overview | Project tasks ...
- Sales Process Management | KPI Dashboard | Sales Process ...
- Status Dashboard | Projects HR dashboard | Project tasks ...