This site uses cookies. By continuing to browse the ConceptDraw site you are agreeing to our Use of Site Cookies.

rack, rack mount, rack solutions, server rack  Rack Diagrams

rack, rack mount, rack solutions, server rack
The Rack Diagrams solution, including a vector stencil library, a collection of samples and a quick-start template, can be useful for all who deal with computer networks. Choosing any of the 54 library's vector shapes, you can design various types of Rack diagrams or Server rack diagrams visualizing 19" rack mounted computers and servers.

How To use House Electrical Plan Software

How we can conduct the electricity at house correctly without a plan? It is impossible. The House electrical diagram depicts locations of switches, outlets, dimmers and lights, and lets understand how you will connect them. But design of House Electrical Plan looks a complex task at a glance, which requires a lot of tools and special experience. But now all is simple with all-inclusive floor plan software - ConceptDraw DIAGRAM. As a house electrical plan software, the ConceptDraw DIAGRAM contains libraries with a large range of professional lighting and electrical symbols, ready-to-use electrical plans samples and examples, and built-in templates for creating great-looking Home floor electrical plans. It is a fastest way to draw Electrical circuit diagrams, Electrical wiring and Circuit schematics, Digital circuits, Electrical equipment, House electrical plans, Satellite television, Cable television, Home cinema, Closed-circuit television when are used the tools of Electric and Telecom Plans Solution from ConceptDraw Solution Park. Files created in Visio for Mac app can be easily imported to ConceptDraw DIAGRAM. Also you may import stencils and even libraries. Try for free an alternative to Visio that Apple users recommend.
Create an Electrical Diagram

Interior Design. Office Layout Plan Design Element

Lucky interior design is an integral part of succesful work at office. The important challenge in office design planning is to find a balance between two main office activities: concentration and communication. Primarily you need to determine with a type of office space, this can be an open space or separate rooms. The first type is more suitable for communication and rapid interaction. That's why open offices and combined spaces are modern types of work space and often used, especially for private offices. Traditional office basically represents separate rooms arranged along the corridor. It is applied for the companies with small number of people or for enterprises divided on separate departments, and is practically inapplicable for teamwork. ConceptDraw DIAGRAM diagramming and vector drawing software extended with Office Layout Plans solution offers a lot of vector stencils libraries with design elements of office furniture and equipment for effective office interior design and office space planning, for easy creation Office Floor Plans and Office Layout Plans. Use ConceptDraw DIAGRAM to visualize process flowcharts, network architecture and program workflows like Visio for Mac and even more. The software can be used with different fields like business, engineering and construction, etc.
How to Draw a Floor Plan
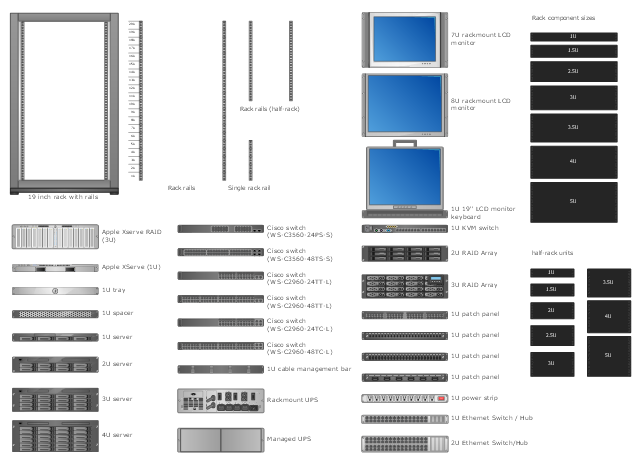
The vector stencils library "Rack diagrams" contains 55 hardware symbols for creating the server rack layout diagrams using the ConceptDraw PRO diagramming and vector drawing software.
"A 19-inch rack is a standardized frame or enclosure for mounting multiple equipment modules. Each module has a front panel that is 19 inches wide, including edges or ears that protrude on each side which allow the module to be fastened to the rack frame with screws. Equipment designed to be placed in a rack is typically described as rack-mount, rack-mount instrument, a rack mounted system, a rack mount chassis, subrack, rack mountable, or occasionally simply shelf. The industry standard rack cabinet is 42U tall." [19-inch rack. Wikipedia]
"A rack unit, U or RU is a unit of measure that describes the height of equipment designed to mount in a 19-inch rack or a 23-inch rack. The size of a piece of rack-mounted equipment is frequently described as a number in "U". For example, one rack unit is often referred to as "1U", 2 rack units as "2U" and so on.
A typical full size rack is 42U, which means it holds just over 6 feet of equipment, and a typical "half-height" rack would be 18-22U, or around 3 feet high." [Rack unit. Wikipedia]
The example "Design elements - Rack diagram" is included in the Rack Diagrams solution from the Computer and Networks area of ConceptDraw Solution Park.
Rack diagram elements
Rack diagram elements, single rack rail, rack unit, rack rails, half-rack, rack rails, patch panel, managed UPS, fiber optic patch panel, Xserve RAID, Apple Xserve Raid 3U, XServe, Apple XServe 1U, UPS, rackmount UPS, LCD monitor keyboard, KVM, Cisco switch, WS-C3560-48TS-S, Cisco switch, WS-C3560-24PS-S, Cisco switch, WS-C2960-48TT-L, Cisco switch, WS-C2960-48TC-L, Cisco switch, WS-C2960-24TT-L, Cisco switch, WS-C2960-24TC-L, 8U rackmount LCD monitor, 8U rack LCD display, 7U rackmount LCD monitor, 4U server, 3U server, 3U RAID array, 2U server, 2U ethernet switch hub, 2U RAID array, 1U tray, 1U spacer, 1U server, 1U power strip, 1U ethernet switch hub, 1U cable management bar, 1U KVM switch, 19 inch rack,

Star Network Topology

Star is a basic computer network topology in which all nodes (computers and peripheral devices) of the network are connected to the central hub or switch with a point-to-point connection, forming a physical network segment. Such network segment can function separately or as a part of complex network topology. The switch is a server, the peripherals are the clients. The large workload and functions of network management are entrusted on the central computer, all information exchange goes through it, so it must to be obligatory the most powerful. The star network topology is a simple topology for design and implementation. Its advantages are high performance, flexible administration capabilities, simplicity of adding additional nodes and search of faults, the fact that a failure of one workstation doesn't affect the work of entire network. But the failure of central hub will result the failure of whole network or network segment - it's the main disadvantage. Use the ConceptDraw DIAGRAM with Computer and Networks solution to designing Star Network Topology Diagrams fast and easy.
Create Network Topology Diagram

Flowchart Definition

Flowchart definition - A Flowchart is a diagram that graphically represents the structure of the system, the flow of steps in a process, algorithm, or the sequence of steps and decisions for execution a process or solution a problem. For depiction the steps there are used specific shapes and graphic symbols which are linked by lines and directional arrows. The main standard shapes are rectangle or box, rounded box, diamond, circle. A Flowchart is a convenient way to observe the follow the process from beginning to end, it lets improve the work of process, highlight the key elements and detach not essential or even excessive steps. The Flowcharts can represent different levels of detail: High-Level Flowchart, Detailed Flowchart, and Deployment or Matrix Flowchart. They are incredibly useful for programmers when developing the programs of any complexity and on any high level language. Create your own Flowcharts using the ConceptDraw DIAGRAM diagramming and vector drawing software and powerful tools of Flowcharts solution from "Diagrams" area.

Cisco Network Design. Cisco icons, shapes, stencils, symbols and design elements

Cisco is the largest company, which specializes in the field of high technologies, develops and sells network equipment mainly for the large organizations and telecommunication companies. Cisco produces wide variety of devices and equipment, such as routers, switches, gateways, servers, network security devices (firewalls, VPN, IDs, etc.), ATM switches, cable modems and DSL equipment, access points Wi-Fi, products for IP telephony, etc. The first commercially successful multi-protocol router, which enabled for previously incompatible computers to communicate between themselves, is also developed by Cisco company. Cisco is a generally accepted standard, which uses globally recognized Cisco icons for all produced Cisco equipment. ConceptDraw DIAGRAM software extended with Cisco Network Diagrams solution from Computer and Network area contains a lot of predesigned Cisco network design elements for professional drawing Cisco network diagrams, visualization computer network topologies, equipment connections and arrangement.

fishbone diagram, Ishikawa diagram, cause and effect analysis Fishbone Diagrams

fishbone diagram, Ishikawa diagram, cause and effect analysis
The Fishbone Diagrams solution extends ConceptDraw DIAGRAM software with the ability to easily draw the Fishbone Diagrams (Ishikawa Diagrams) to clearly see the cause and effect analysis and also problem solving. The vector graphic diagrams produced using this solution can be used in whitepapers, presentations, datasheets, posters, and published technical material.

Garrett IA Diagrams with ConceptDraw DIAGRAM

Garrett IA diagrams are used at development of Internet-resources, in particulars at projecting of interactions of web-resource elements. The diagram of information architecture of the web resource which is constructed correctly with necessary details presents to developers the resource in comprehensible and visual way.