This site uses cookies. By continuing to browse the ConceptDraw site you are agreeing to our Use of Site Cookies.

Basic Flowchart Symbols and Meaning

Flowchart Symbols and Meaning - Provides a visual representation of basic flowchart symbols and their proposed use in professional workflow diagram, standard process flow diagram and communicating the structure of a well-developed web site, as well as their correlation in developing on-line instructional projects. See flowchart's symbols by specifics of process flow diagram symbols and workflow diagram symbols.
How to Build a Flowchart

Types of Flowcharts

A Flowchart is a graphically representation of the process, algorithm or the step-by-step solution of the problem. There are ten types of Flowcharts. Using the Flowcharts solution from the Diagrams area of ConceptDraw Solution Park you can easy and quickly design the Flowchart of any of these types.
How to Simplify Flow Charting

TQM Diagram Tool

The Total Quality Management Diagram solution helps you and your organization visualize business and industrial processes. Create Total Quality Management diagrams for business process with ConceptDraw software.

ERD Symbols and Meanings

Crow's foot notation is used in Barker's Notation, Structured Systems Analysis and Design Method (SSADM) and information engineering. Crow's foot diagrams represent entities as boxes, and relationships as lines between the boxes. Different shapes at the ends of these lines represent the cardinality of the relationship.
The Chen's ERD notation is still used and is considered to present a more detailed way of representing entities and relationships.
To create an ERD, software engineers mainly turn to dedicated drawing software, which contain the full notation resources for their specific database design - ERD symbols and meanings. CS Odessa has released an all-inclusive Entity-Relationship Diagram (ERD) solution for their powerful drawing program, ConceptDraw DIAGRAM.
How to Build an Entity Relationship Diagram (ERD)
HelpDesk

How to Create Flowchart Using Standard Flowchart Symbols

Flowcharts are used to display an algorithm for consistent execution of certain steps. A flowchart is probably the easiest way to make a graphical representation of any process. Flowcharts use the set of standard geometric symbols and arrows to define relationships. ConceptDraw DIAGRAM allows you to create professional flowchart quickly and easily. The ability to create flowcharts is contained in the Flowcharts solution. The solution provides a set of special tools for creating flowcharts.

How to Build a Flowchart

The ConceptDraw DIAGRAM is a professional software for quick creating great looking flowcharts. The vector stencils from object libraries allows you to use RapidDraw technology. By the clicking on direction arrows one can add new object to flowcharts. This technology gives to users the ability to fast creating visualization for the structural data.
Learn the basics of flowcharting and see how to build create a flowchart using ConceptDraw automatic drawing tools.

Business Process Flowchart Symbols

The business process flowchart symbols used for business process mapping are predefined by Business Process Modeling Notation (BPMN) and actually have their roots in the data processing diagrams and programming flow charts. Business Process flowchart symbols provide drawing business process flowcharts, diagrams and maps of any complexity.

Workflow Process Example

One of the most popular option helps to draw diagrams faster is pre-designed set of examples related to each kind of diagram. ConceptDraw DIAGRAM software extended with the Workflow Diagrams solution delivers a complete set of workflow process examples helps you to start making your own workflow faster.

Visio Files and ConceptDraw

Visio Files and ConceptDraw. ConceptDraw DIAGRAM is compatible with MS Visio.VDX formatted files.VDX is Visio’s open XML file format, and it can be easily imported and exported by ConceptDraw DIAGRAM.

Entity Relationship Diagram Examples
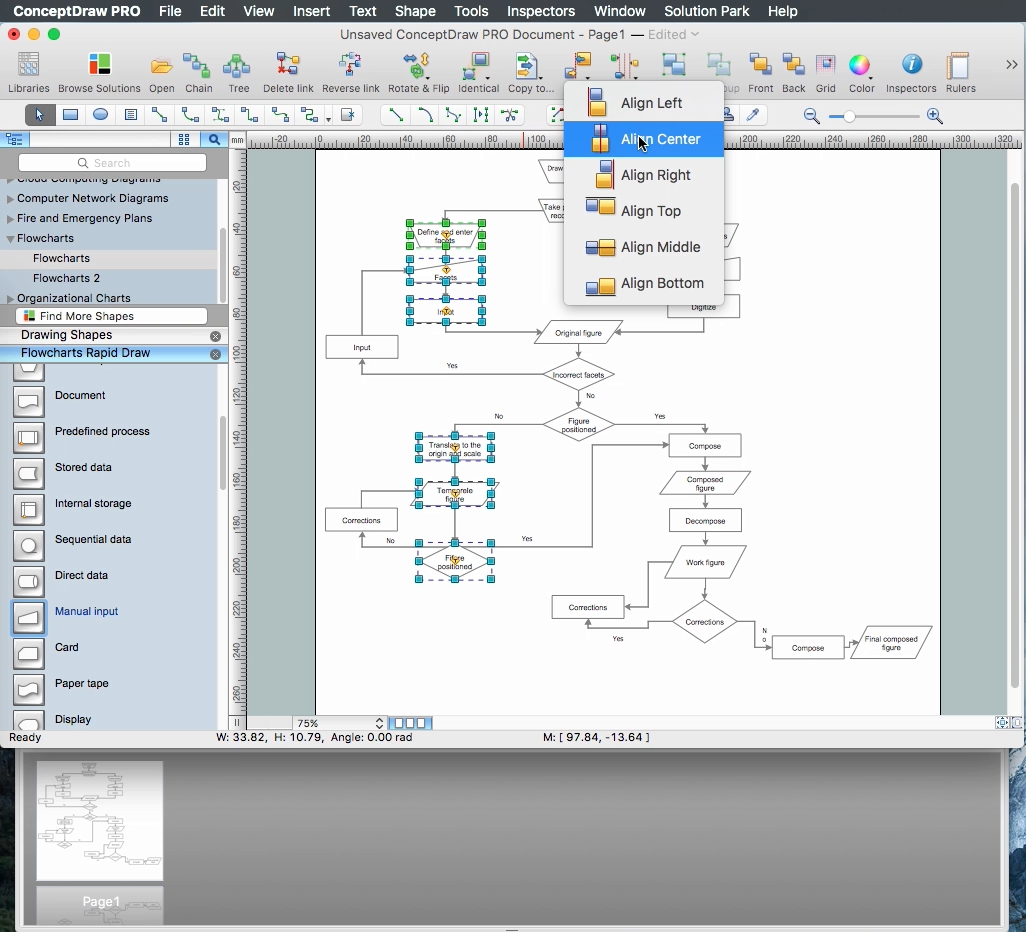
Creating an entity-relationship (ER) model is to visually represent the structure of a business database, where data equates to entities (or objects) that are linked by defined relationships expressing dependencies and requirements. By nature it is an abstract visualization, the first step in the design process towards creating a logical and functional database.
ConceptDraw gives the ability to describe a database using the Entity-Relationship model. Entity-Relationship Diagram solution includes icons advocated by Chen's and Crow’s Foot notation that can be used when describing a database.
How to Build an Entity Relationship Diagram (ERD)