Use this template to design your scatter charts.
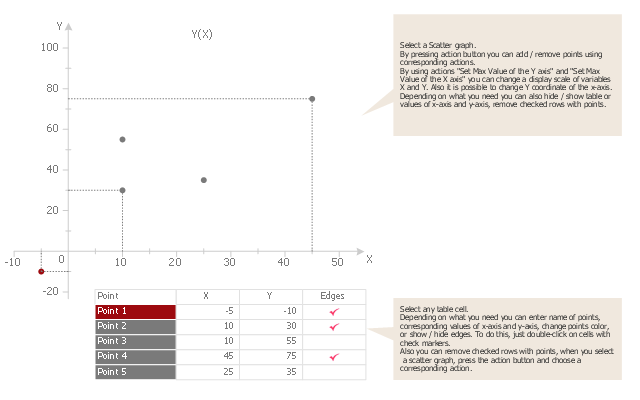
"A scatter plot, scatterplot, or scattergraph is a type of mathematical diagram using Cartesian coordinates to display values for two variables for a set of data.
The data is displayed as a collection of points, each having the value of one variable determining the position on the horizontal axis and the value of the other variable determining the position on the vertical axis. This kind of plot is also called a scatter chart, scattergram, scatter diagram, or scatter graph." [Scatter plot. Wikipedia]
The template "Scatter graph" for the ConceptDraw PRO diagramming and vector drawing software is included in the Scatter Diagrams solution from the Graphs and Charts area of ConceptDraw Solution Park.
Template
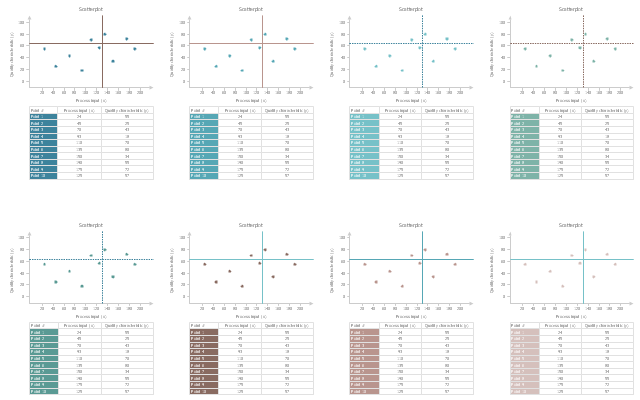
The vector stencils library "Scatterplot" contains 8 scatter diagram templates.
Use to design your scatter graphs with ConceptDraw PRO diagramming and vector drawing software.
"A scatter plot, scatterplot, or scattergraph is a type of mathematical diagram using Cartesian coordinates to display values for typically two variables for a set of data. If the points are color-coded you can increase the number of displayed variables to three.
The data is displayed as a collection of points, each having the value of one variable determining the position on the horizontal axis and the value of the other variable determining the position on the vertical axis. This kind of plot is also called a scatter chart, scattergram, scatter diagram, or scatter graph. ...
The scatter diagram is one of the seven basic tools of quality control." [Scatter plot. Wikipedia]
The example of scatter chart templates "Design elements - Scatterplot" is included in the Seven Basic Tools of Quality solution from the Quality area of ConceptDraw Solution Park.
Scatter graph templates
The vector stencils library Correlation charts from the Corellation Dashboard solution contains 4 templates of scatter plots for drawing the visual dashboards using the ConceptDraw PRO diagramming and vector drawing software.
"A scatter plot, scatterplot, or scattergraph is a type of mathematical diagram using Cartesian coordinates to display values for two variables for a set of data.
The data is displayed as a collection of points, each having the value of one variable determining the position on the horizontal axis and the value of the other variable determining the position on the vertical axis. This kind of plot is also called a scatter chart, scattergram, scatter diagram, or scatter graph." [Scatter plot. Wikipedia]
The example "Design elements - Correlation charts" is included in the Corellation Dashboard solution from the area "What is a Dashboard" of ConceptDraw Solution Park.
Scatter graphs

This work flow chart sample was redesigned from the picture "Weather Forecast" from the article "Simulation Workflows".
[iaas.uni-stuttgart.de/ forschung/ projects/ simtech/ sim-workflows.php]
"(1) The weather is predicted for a particular geological area. Hence, the workflow is fed with a model of the geophysical environment of ground, air and water for a requested area.
(2) Over a specified period of time (e.g. 6 hours) several different variables are measured and observed. Ground stations, ships, airplanes, weather balloons, satellites and buoys measure the air pressure, air/ water temperature, wind velocity, air humidity, vertical temperature profiles, cloud velocity, rain fall, and more.
(3) This data needs to be collected from the different sources and stored for later access.
(4) The collected data is analyzed and transformed into a common format (e.g. Fahrenheit to Celsius scale). The normalized values are used to create the current state of the atmosphere.
(5) Then, a numerical weather forecast is made based on mathematical-physical models (e.g. GFS - Global Forecast System, UKMO - United Kingdom MOdel, GME - global model of Deutscher Wetterdienst). The environmental area needs to be discretized beforehand using grid cells. The physical parameters measured in Step 2 are exposed in 3D space as timely function. This leads to a system of partial differential equations reflecting the physical relations that is solved numerically.
(6) The results of the numerical models are complemented with a statistical interpretation (e.g. with MOS - Model-Output-Statistics). That means the forecast result of the numerical models is compared to statistical weather data. Known forecast failures are corrected.
(7) The numerical post-processing is done with DMO (Direct Model Output): the numerical results are interpolated for specific geological locations.
(8) Additionally, a statistical post-processing step removes failures of measuring devices (e.g. using KALMAN filters).
(9) The statistical interpretation and the numerical results are then observed and interpreted by meteorologists based on their subjective experiences.
(10) Finally, the weather forecast is visualized and presented to interested people." [iaas.uni-stuttgart.de/ forschung/ projects/ simtech/ sim-workflows.php]
The example "Workflow diagram - Weather forecast" was drawn using the ConceptDraw PRO diagramming and vector drawing software extended with the Workflow Diagrams solution from the Business Processes area of ConceptDraw Solution Park.
Work flow chart

- Venn Diagram Examples for Problem Solving . Quantum Information ...
- Bar Diagrams for Problem Solving. Create space science bar charts ...
- Basic Diagramming | Venn diagrams with ConceptDraw PRO ...
- Basic Diagramming | Mathematical pendulum diagram | Venn ...
- Basic Diagramming | Mathematical Diagrams | Mathematics ...
- Block Diagrams | Basic Diagramming | Block Diagrams | Examples ...
- Basic Diagramming | Mathematical pendulum diagram | Scatter ...
- Scientific Diagrams
- Mathematical Diagrams Png
- Cause and Effect Analysis (Fishbone Diagrams )
- Mathematics | Biology | Chemistry | Solution Science
- Bar Diagrams for Problem Solving. Create space science bar charts ...
- Bar Chart Examples | Column Chart Software | How to Create a Bar ...
- Mathematics Symbols | Mathematics | Mathematical Diagrams ...
- Venn Diagram Examples for Problem Solving. Environmental Social ...
- The Best Choice for Creating Diagram
- Basic Flowchart Symbols | Business Diagram Software | Examples ...
- Bar Chart Software
- Swim Lane Diagrams | Cross-Functional Flowchart (Swim Lanes ...
- Mathematics | Biology | Science and Education Area | Solution Of ...