HelpDesk
How to Create a Venn Diagram in ConceptDraw PRO

Venn Diagram

 Venn Diagrams
Venn Diagrams are actively used to illustrate simple set relationships in set theory and probability theory, logic and statistics, mathematics and computer science, linguistics, sociology, and marketing. Venn Diagrams are also often used to visually summarize the status and future viability of a project.
Venn Diagram Examples for Problem Solving. Venn Diagram as a Truth Table

 Basic Diagramming
This solution extends ConceptDraw PRO software with the specific tools you need to easily draw flowcharts, block diagrams, histograms, pie charts, divided bar diagrams, line graphs, circular arrows diagrams, Venn diagrams, bubble diagrams and concept maps
Venn Diagram Template for Word

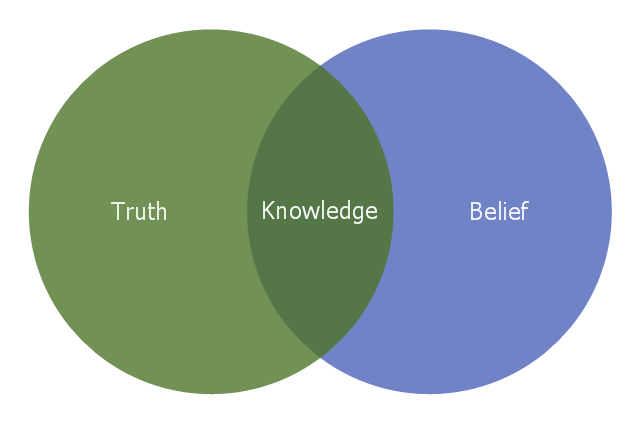
Illustration of Plato's definition of knowledge.
This Venn diagram example was redrawn from the Wikimedia Commons file: Belief Venn diagram.svg. [commons.wikimedia.org/ wiki/ File:Belief_ Venn_ diagram.svg]
"Justified true belief is a definition of knowledge that is most frequently credited to Plato and his dialogues. The concept of justified true belief states that in order to know that a given proposition is true, one must not only believe the relevant true proposition, but one must also have justification for doing so. In more formal terms, a subject S knows that a proposition P is true if and only if:
(1) P is true,
(2) S believes that P is true, and
(3) S is justified in believing that P is true" [Justified true belief. Wikipedia]
The Venn diagram example "Knowledge" was created using the ConceptDraw PRO diagramming and vector drawing software extended with the Venn Diagrams solution from the area "What is a Diagram" of ConceptDraw Solution Park.
Venn diagram
Venn Diagram Examples for Problem Solving. Environmental Social Science. Human Sustainability Confluence

Create your Venn diagrams for problem solving in environmental social science using the ConceptDraw PRO diagramming and vector drawing software extended with the Venn Diagrams solution from the area "What is a Diagram" of ConceptDraw Solution Park.
Cylinder Venn Diagram

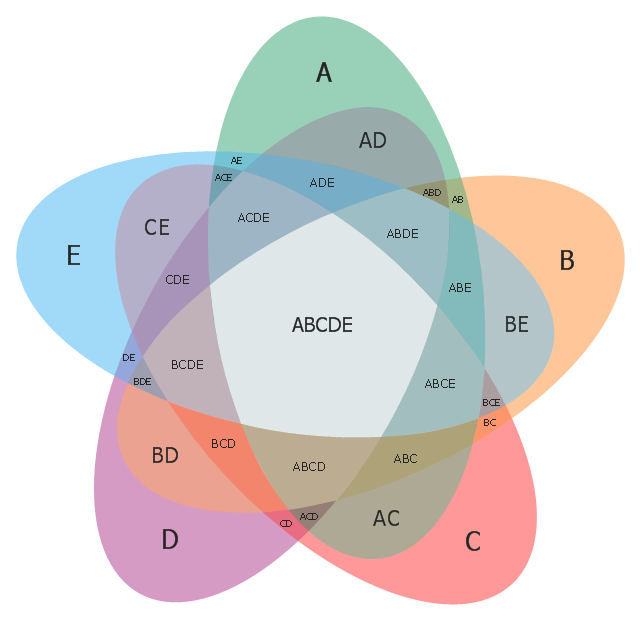
"Five-set Venn diagram using congruent ellipses in a radially symmetrical arrangement devised by Branko Grünbaum. Labels have been simplified for greater readability." [Venn diagram. Wikipedia]
This 5-set Venn diagram template for the ConceptDraw PRO diagramming and vector drawing software is included in the Venn Diagrams solution from the area "What is a Diagram" of ConceptDraw Solution Park.
This 5-set Venn diagram template for the ConceptDraw PRO diagramming and vector drawing software is included in the Venn Diagrams solution from the area "What is a Diagram" of ConceptDraw Solution Park.
Venn diagram
Venn Diagram Examples for Problem Solving . Quantum Information Science. BQP Complexity

Simple Diagramming


3 Circle Venn Diagram. Venn Diagram Example

Venn Diagrams visualize all possible logical intersections between several sets and are widely used in mathematics, logic, statistics, marketing, sociology, etc.
Multi Layer Venn Diagram. Venn Diagram Example

Venn Diagram Template

- Venn diagram - Path to sustainable development | Matrices | Line ...
- Venn Diagram Template for Word | How to Add a Block Diagram to a ...
- Venn Diagram Template for Word | Bar Chart Template for Word ...
- Venn Diagram Concept Map
- Venn Diagram Examples for Problem Solving. Computer Science ...
- Venn Diagram Template for Word | Multi Layer Venn Diagram . Venn ...
- 25 Typical Orgcharts | Venn Diagram Template for Word ...
- Concept Maps | Venn Diagrams | Venn Diagram Examples for ...
- Multi Layer Venn Diagram . Venn Diagram Example | Process ...
- Venn Diagram Examples for Problem Solving. Computer Science ...
- Venn Diagram | Venn Diagram Template for Word | Basic Circles ...
- Venn Diagrams | Multi Layer Venn Diagram . Venn Diagram ...
- Best Diagramming Software for Mac | Venn Diagram Examples for ...
- Venn Diagrams | Venn Diagram Examples | Circles Venn Diagram ...
- Venn diagram - Path to sustainable development | Venn Diagram ...
- Venn Diagram | Process Flowchart | Software Diagrams | Diagram ...
- Venn Diagram Template for Word | Venn Diagrams | 5-Set Venn ...
- Venn Diagrams | Venn Diagram | How to Create a Venn Diagram in ...
- Venn Diagram Examples for Problem Solving. Environmental Social ...
- Circles Venn Diagram