Column Chart Software

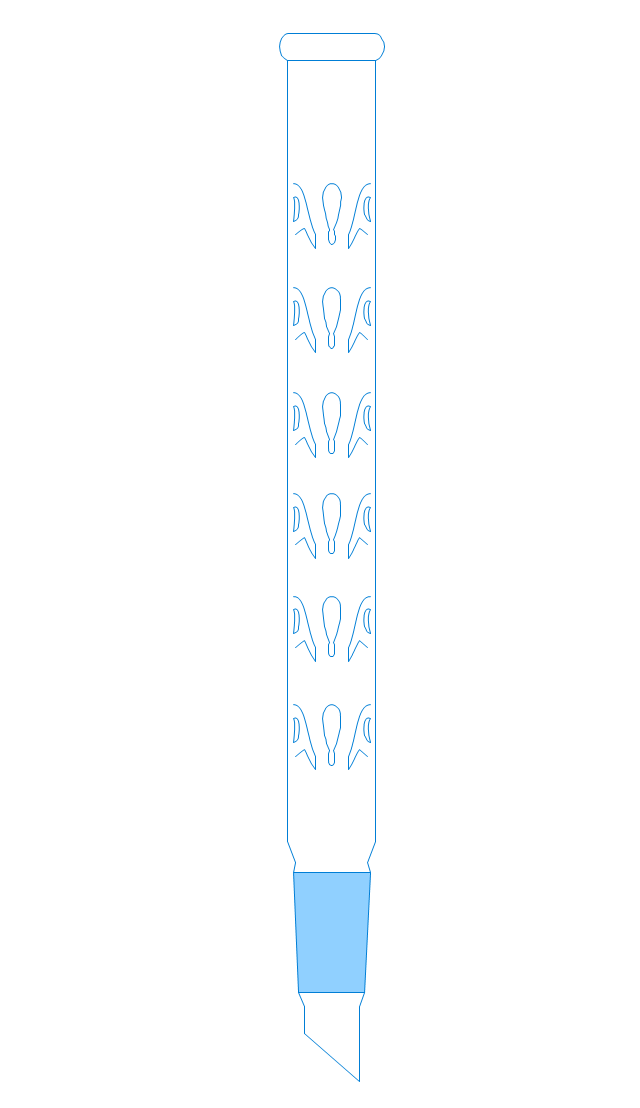
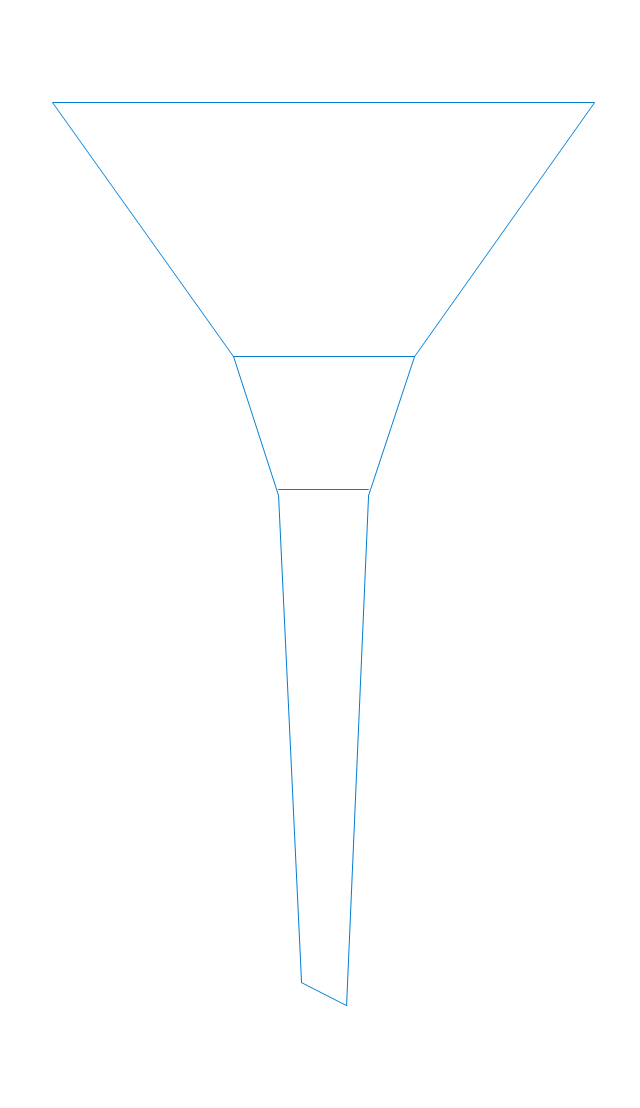
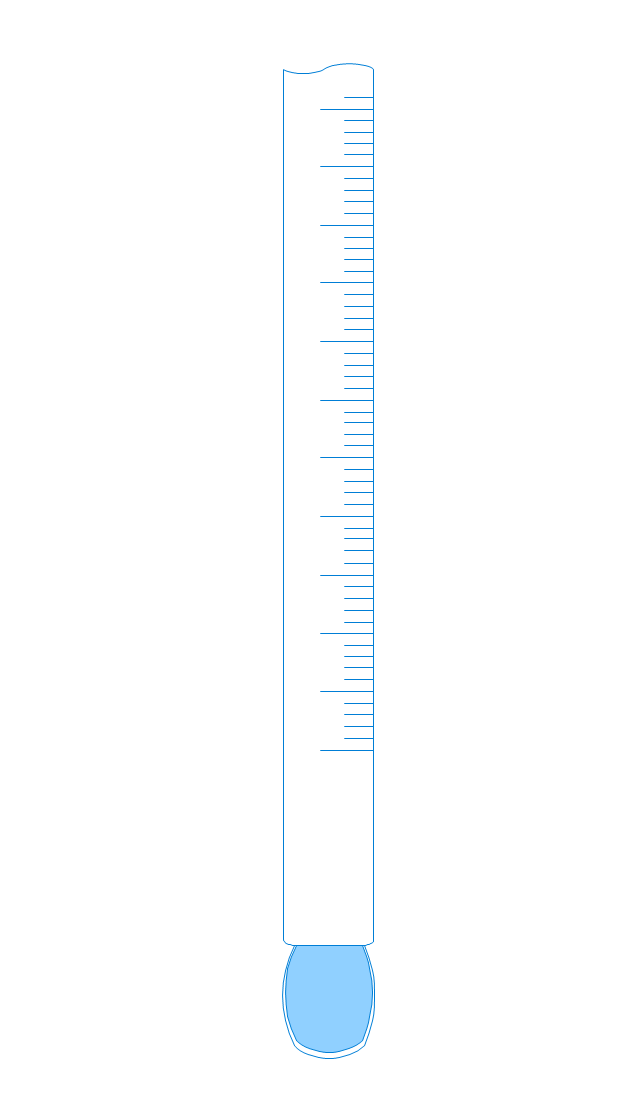
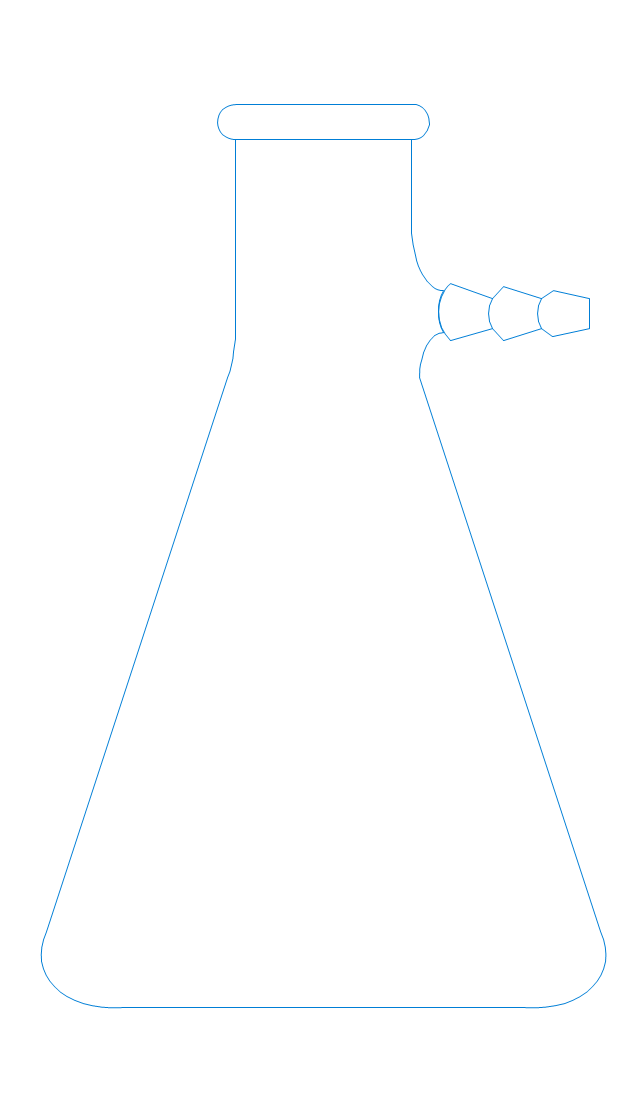
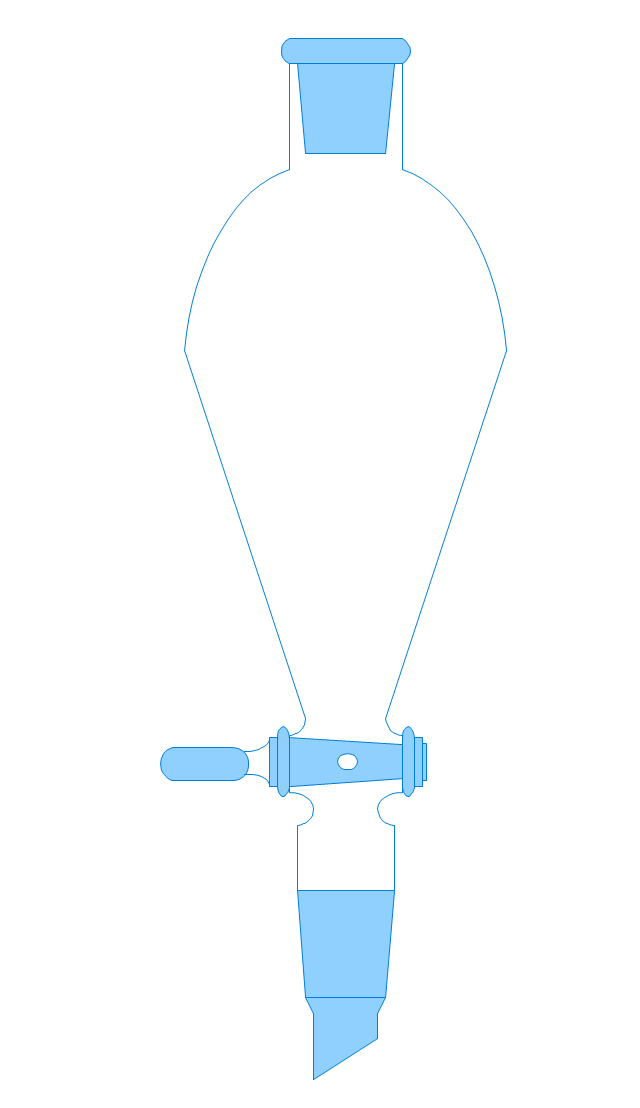
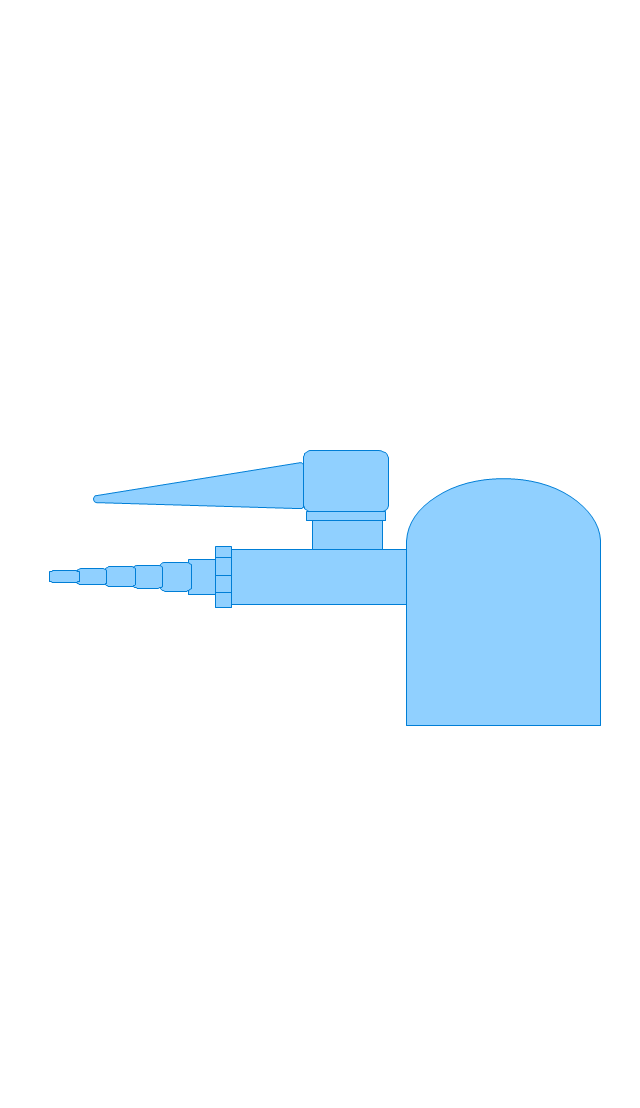
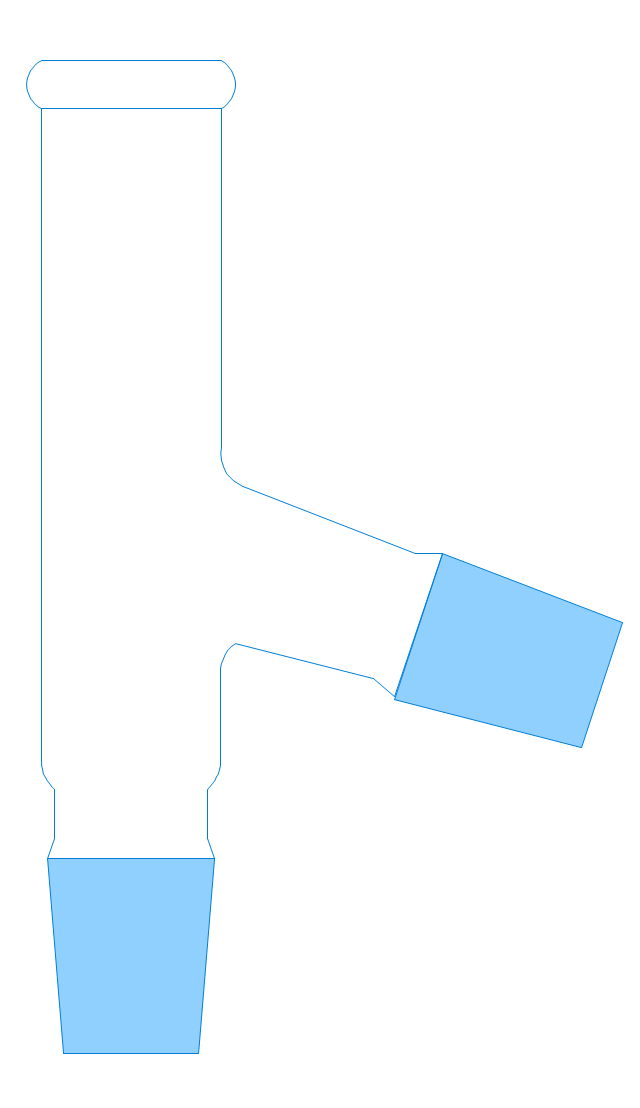
The vector stencils library "Laboratory equipment" contains 31 clipart icons of chemical laboratory equipment and labware.
Use these shapes for drawing part assembly and mounting schemes of glassware apparatus in chemical experiment diagrams and illustrations in the ConceptDraw PRO diagramming and vector drawing software extended with the Chemistry solution from the Science and Education area of ConceptDraw Solution Park.
Use these shapes for drawing part assembly and mounting schemes of glassware apparatus in chemical experiment diagrams and illustrations in the ConceptDraw PRO diagramming and vector drawing software extended with the Chemistry solution from the Science and Education area of ConceptDraw Solution Park.
Vigreux distillation column
Hirsch funnel
Oil bath

Steam bath
Thermometer
Tap (valve)
--laboratory-equipment---vector-stencils-library.png--diagram-flowchart-example.png)
Vacuum adaptor
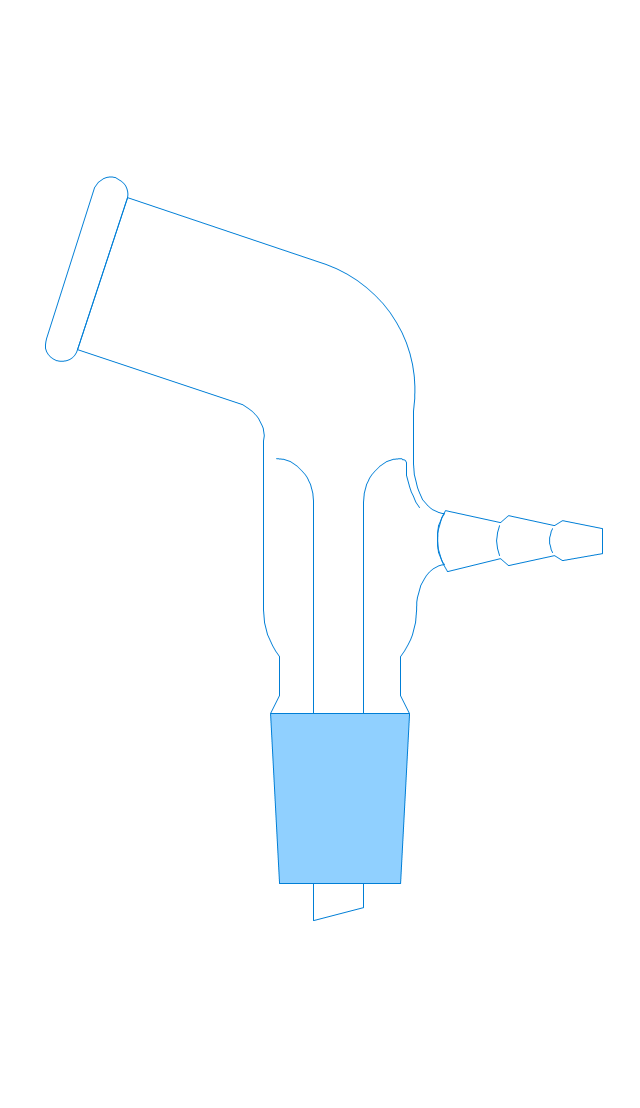
Liebig condenser (long)
-laboratory-equipment---vector-stencils-library.png--diagram-flowchart-example.png)
Liebig condenser (short)
-laboratory-equipment---vector-stencils-library.png--diagram-flowchart-example.png)
Water faucet
Büchner flask
Stemless funnel
Stemmed funnel

Separatory funnel
Heating mantle

Hot plate

Gas tap
Folded filter paper

Y-Adaptor
Claisen adapter

Bunsen burner
Büchner funnel

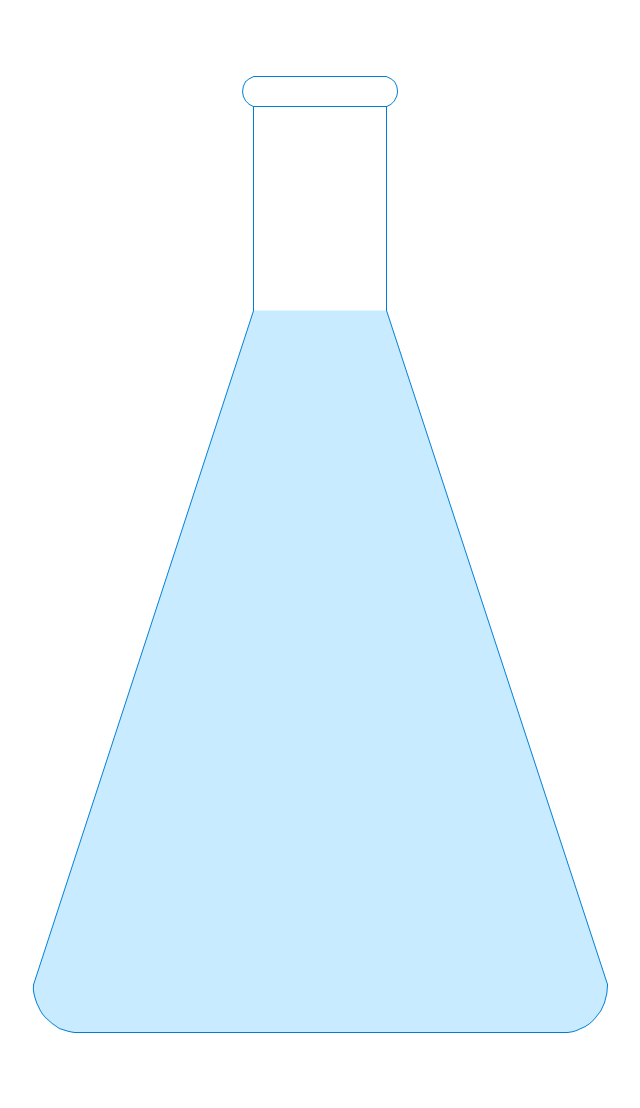
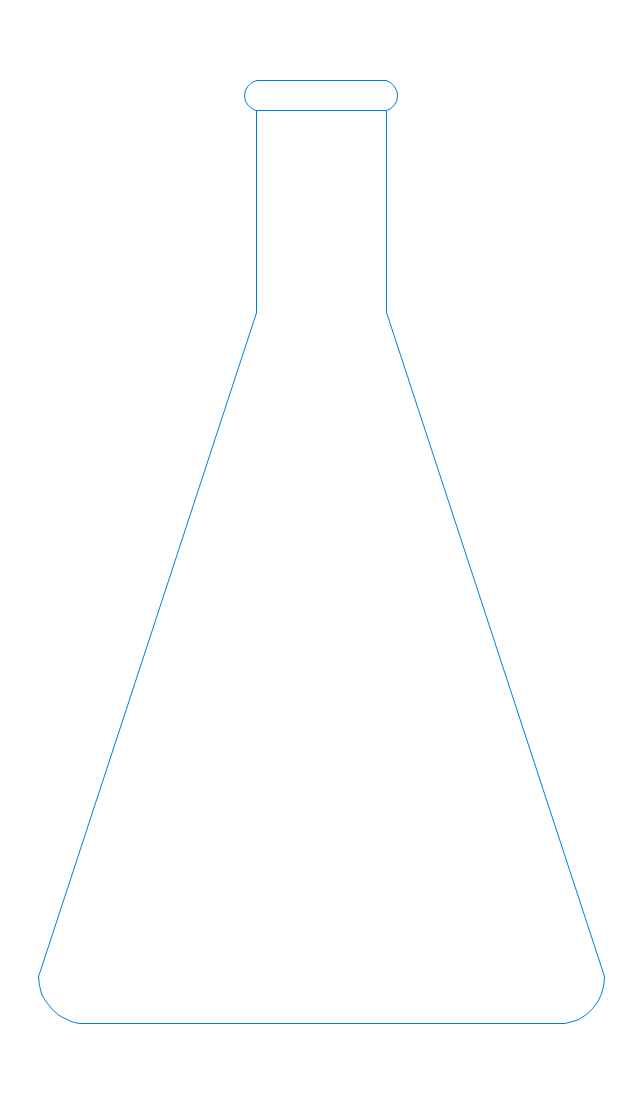
Erlenmeyer flask, 25ml

Round-bottom flask, 50ml

Round-bottom flask, 250ml

Beaker 100ml, filled
Beaker 100ml, empty
Beaker 500ml, filled
Beaker 500ml, empty
Erlenmeyer flask 250ml, filled
Erlenmeyer flask 250ml, empty
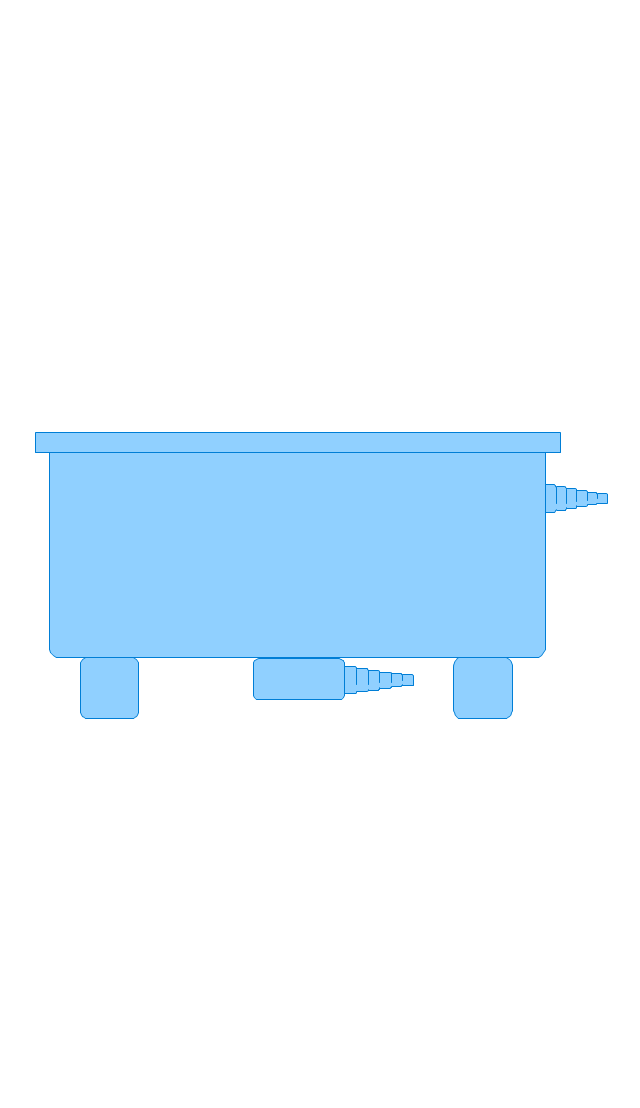
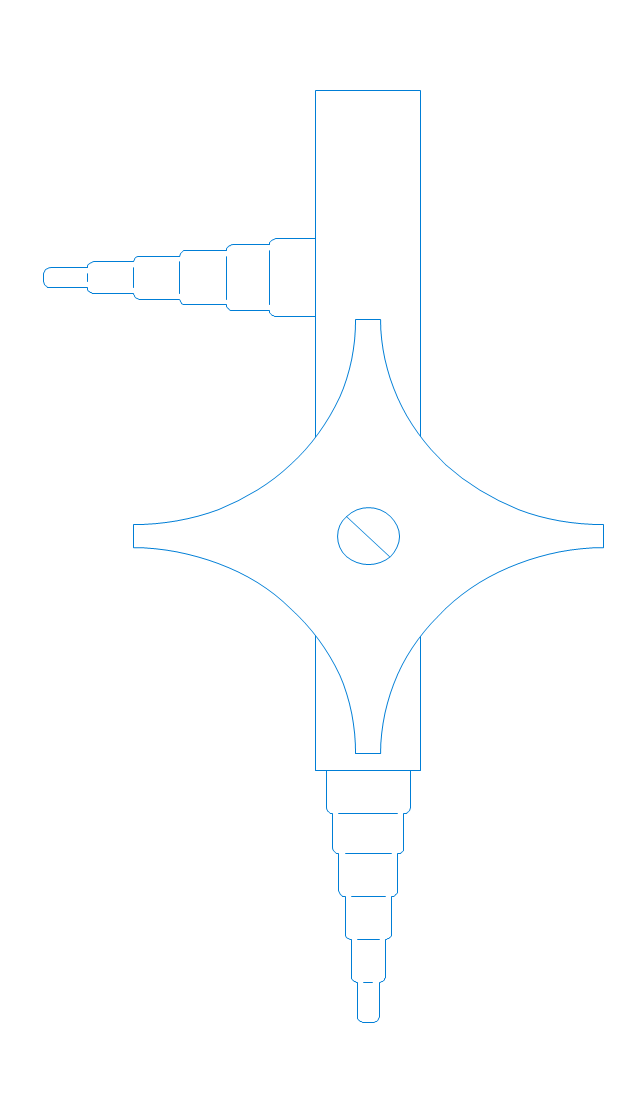
The vector stencils library "Vessels" contains 40 symbols of vessels, containers, tanks, drums, and basins.
Use it for drawing industrial and manufacturing process flow diagrams, materials handling systems, and feed systems in the ConceptDraw PRO software extended with the Chemical and Process Engineering solution from the Chemical and Process Engineering area of ConceptDraw Solution Park.
www.conceptdraw.com/ solution-park/ engineering-chemical-process
Tray (dashed)
-vessels---vector-stencils-library.png--diagram-flowchart-example.png)
Tray (solid)
-vessels---vector-stencils-library.png--diagram-flowchart-example.png)
Water surface

Branch fitting

Access point

Flanged access point

Vessel flat ends

Vessel curved ends

Vessel angled ends

Column

Column (seam)
-vessels---vector-stencils-library.png--diagram-flowchart-example.png)
Tray column

Fluid contacting

Reaction vessel
Open tank with lip

Open tank

Clarifier

Closed tank

Closed tank (peaked roof)
-vessels---vector-stencils-library.png--diagram-flowchart-example.png)
Closed tank (sump)
-vessels---vector-stencils-library.png--diagram-flowchart-example.png)
Closed tank (sump, peaked roof)
-vessels---vector-stencils-library.png--diagram-flowchart-example.png)
Covered tank fixed roof

Covered tank floating roof

Covered tank fixed roof (sump)
-vessels---vector-stencils-library.png--diagram-flowchart-example.png)
Covered tank floating roof (sump)
-vessels---vector-stencils-library.png--diagram-flowchart-example.png)
Gas holder

Storage sphere

Barrel

Gas cylinder

Bag

Carrying vessel moveable

Carrying vessel

Carrying vessel cargo
Autoclave anchor

Autoclave helical

Autoclave propeller

Autoclave anchor (motor)
-vessels---vector-stencils-library.png--diagram-flowchart-example.png)
Autoclave helical (motor)
-vessels---vector-stencils-library.png--diagram-flowchart-example.png)
Autoclave propeller (motor)
-vessels---vector-stencils-library.png--diagram-flowchart-example.png)
Tank

The vector stencils library "Bar charts" contains 7 templates of bar and column charts for visualizing quantitative and statistical data comparison and changes in time series. Drag template from library to your document and enter your data.
Use these shapes to draw your bar graphs in the ConceptDraw PRO diagramming and vector drawing software.
The vector stencils library "Bar charts" is included in the Bar Graphs solution from the Graphs and Charts area of ConceptDraw Solution Park.
Use these shapes to draw your bar graphs in the ConceptDraw PRO diagramming and vector drawing software.
The vector stencils library "Bar charts" is included in the Bar Graphs solution from the Graphs and Charts area of ConceptDraw Solution Park.
Vertical bar chart

Horizontal bar chart

3D bar chart

Cylindrical bar chart

Double bar chart

Column chart - serial

Horizontal bar chart - serial

Coordinate system 3D

The vector stencils library "Sales dashboard" contains 27 charts and graphic indicators.
Use it for drawing sales dashboards in the ConceptDraw PRO diagramming and vector drawing software extended with the Sales Dashboard solution from the Marketing area of ConceptDraw Solution Park.
Use it for drawing sales dashboards in the ConceptDraw PRO diagramming and vector drawing software extended with the Sales Dashboard solution from the Marketing area of ConceptDraw Solution Park.
Column Chart

Bar Chart

Line Chart

Divided Bar

Pie Chart

Two Bubbles Indicator

Speedometer Gauge 1

Speedometer Gauge 2

Speedometer Gauge 3

Speedometer Gauge 4

Slider Horizontal 1

Slider Horizontal 2

Slider Horizontal 3

Slider Horizontal 4

Slider Horizontal 5

Slider Horizontal 6

Slider Horizontal 7

Slider Vertical 1

Slider Vertical 2

Slider Vertical 3

Bullet 1

Bullet 2

Bullet 3

Bullet 4

Backgroung 1

Backgroung 2

Backgroung 3

The vector stencils library "Education charts" contains 12 graphs and charts: area chart, column chart, divided bar diagram, histogram, horizontal bar graph, line graph, pie chart, ring chart, scatter plot.
Use it to create your education infogram in the ConceptDraw PRO diagramming and vector drawing software.
The vector stencils library "Education charts" is included in the Education Infographics solution from the Business Infographics area of ConceptDraw Solution Park.
Use it to create your education infogram in the ConceptDraw PRO diagramming and vector drawing software.
The vector stencils library "Education charts" is included in the Education Infographics solution from the Business Infographics area of ConceptDraw Solution Park.
Area chart - serial

Column chart

Column chart - serial

Divided bar diagram

Frequency histogram

Horizontal bar chart

Horizontal bar chart - serial

Line chart - serial

Pie chart

Ring chart

Scatter plot

Scatter plot - serial

Column Chart Examples

The vector stencils library "Interactions" contains 18 interaction elements icons: mouse pointers, splitters, select frame.
Use it to design graphic user interface (GUI) prototypes of your software applications for Windows 8.
"In computing, a pointer or mouse cursor (as part of a personal computer WIMP style of interaction) is a graphical image on the computer monitor or other display device. The pointer echoes movements of the pointing device, commonly a mouse or touchpad, and signals the point where actions of the user take place. It can be used to select and move other graphical user interface elements, and is distinct from the cursor, which responds to keyboard input. The cursor may also be repositioned using the pointer.
The pointer commonly appears as an angled arrow, (angled because historically that improved appearance on low resolution screens) but it can vary within different programs or operating systems. The use of a pointer is employed when the input method, or pointing device, is a device that can move fluidly across a screen and select or highlight objects on the screen." [Pointer (graphical user interfaces). Wikipedia]
The design elements example "Interactions - Vector stencils library" was created using the ConceptDraw PRO diagramming and vector drawing software extended with the Windows 8 User Interface solution from the Software Development area of ConceptDraw Solution Park.
Normal select pointer

Link select pointer

Text select pointer

Precision select pointer

Move pointer
Pan pointer
Vertical resize pointer

Horizontal resize pointer
Diagonal resize pointer

Diagonal resize pointer 2

Row resize pointer

Column resize pointer

Window splitter - vertically

Window splitter - horizontally

Working in background pointer

Busy pointer

Unavailable pointer

Normal select frame

Column Chart Template

The 3D vertical bar graph sample shows the Iran internet users per 100 person from 2000 to 2011. It was designed on the base of the Commons Wikimedia file: Iran internet users per 100 person.png.
[commons.wikimedia.org/ wiki/ File:Iran_ internet_ users_ per_ 100_ person.png]
This file is licensed under the Creative Commons Attribution-Share Alike 3.0 Unported license. [creativecommons.org/ licenses/ by-sa/ 3.0/ deed.en]
The data source is World Bank: [data.worldbank.org/ country/ iran-islamic-republic]
"In 1993 Iran became the second country in the Middle East to be connected to the Internet, and since then the government has made significant efforts to improve the nation's ICT infrastructure. Iran's national Internet connectivity infrastructure is based on two major networks: the public switched telephone network (PSTN) and the public data network. The PSTN provides a connection for end-users to Internet service providers (ISPs) over mostly digital lines and supports modem-based connections. The Data Communication Company of Iran (DCI), a subsidiary of TCI, operates the public data network." [Internet in Iran. Wikipedia]
The 3D column chart example "Iran internet users per 100 person" was created using the ConceptDraw PRO diagramming and vector drawing software extended with the Bar Graphs solution from the Graphs and Charts area of ConceptDraw Solution Park.
3D Column chart

The vector stencils library "Office equipment" contains 33 shapes of office equipment, electronics and accessories. Use these shapes for drawing office floor plans and equipment layouts in the ConceptDraw PRO diagramming and vector drawing software extended with the Office Layout Plans solution from the Building Plans area of ConceptDraw Solution Park.
Telephone

Fax

Desktop PC

PC

PC Monitor

Keyboard

Tower PC

Mouse

PC Column

Switch

Router

Hub

Modem

Scanner

Printer

Plotter

Document Shredder

Office Lamp

Projector

Overhead Projector

Projection Screen

Marker Board

Plasma Panel

Acoustic Column

Cash Register

POS-Terminal

Xerox

Copier

Table Lamp

Paper Tray

Waste Can

Square Waste Can

Coat Rack

The vector stencils library "Management indicators" contains 14 visual indicators.
Use it to create your management infogram in the ConceptDraw PRO diagramming and vector drawing software.
The example "Management indicators - Vector stencils library" is included in the solution "Marketing infographics" from the "Business infographics" area of ConceptDraw Solution Park.
Use it to create your management infogram in the ConceptDraw PRO diagramming and vector drawing software.
The example "Management indicators - Vector stencils library" is included in the solution "Marketing infographics" from the "Business infographics" area of ConceptDraw Solution Park.
1-Sector donut chart

1-Sector pie chart

2-Bars horizontal bar chart

2-Columns arrow chart
2-Columns arrow chart 2
2-Sectors donut chart

2-Sectors pie chart

Bullet indicator

Progress bar

Radial gauge

Semi-radial gauge

Square chart 10x10 - filling from above

Square chart 10x10 - filling from below

Stickman row pictograph

Sales Growth. Bar Graphs Example

Chart Maker for Presentations

Pyramid Diagram

- Column Resize Icon Png
- Column Chart Template | Sales workflow - Vector stencils library ...
- Hotel floor plan | Office equipment - Vector stencils library | Design ...
- Walls, shell and structure - Vector stencils library | Walls, shell and ...
- Interactions - Vector stencils library | Unavailable Mouse Pointer Png
- Line Chart Vector Png
- Water Flow Vector Png
- Horizontal Vector Png
- Laboratory equipment - Vector stencils library | Condenser Valve ...
- 3D Column chart - Iran internet users per 100 person | Process ...
- Pyramid diagrams - Vector stencils library | Directional Maps | Bar ...
- Iran Vector Png
- Vector Heading Banner Png
- Bar Chart | Basic Diagramming | Column Chart Template | Beautiful ...
- Management indicators - Vector stencils library | Blue Gage Indicator ...
- Office equipment - Vector stencils library | Interior Design Office ...
- 960 Grid System 16- column layout | Design elements - Wireframe ...
- 3d Bar Graph Horizontal Png
- Horizontal Bar Chart Png
- Plumbing and Piping Plans | Laboratory equipment - Vector stencils ...