Data modeling with ConceptDraw PRO

Cross Functional Flowchart for Business Process Mapping

Cross-Functional Process Map Template

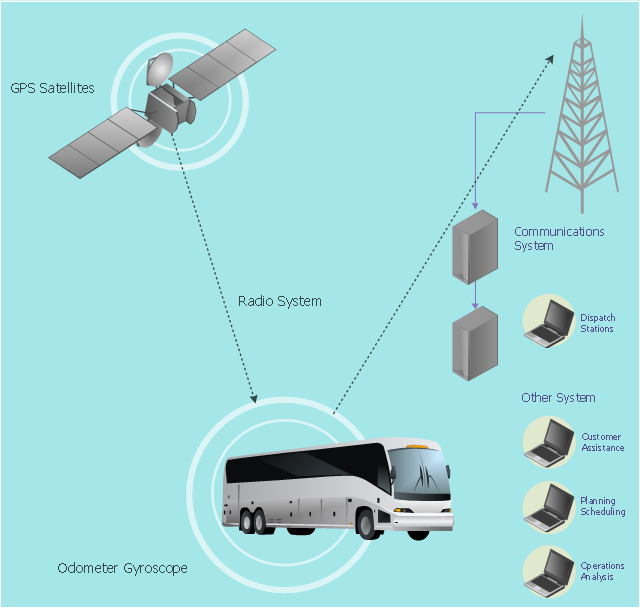
This vehicular network diagram example was drawn on the base of picture illustrating the article "Automatic Vehicle Location: Rural Transit" from the website of the Research and Innovative Technology Administration (RITA), U.S. Department of Transportation (US DOT).
"Automatic Vehicle Location (AVL) systems calculate the real-time location of any vehicle equipped with a Global Positioning Satellite (GPS) receiver. Data are then transmitted to the transit center with use of radio or cellular communications and can be used immediately for daily operations as well as archived for further analysis.
As a stand-alone technology, an AVL system can be used to monitor on-time performance. When combined with other technologies, AVL can deliver many benefits in the areas of fleet management, service planning, safety and security, traveler information, fare payment, vehicle component monitoring, and data collection. Since the greatest benefits from AVL are achieved by combining it with other Intelligent Transportation System (ITS) technologies, AVL is most appropriate for large rural agencies with more than 30 vehicles that plan to implement a comprehensive ITS."
[pcb.its.dot.gov/ factsheets/ avl/ avlRural_ overview.asp]
The vehicular network diagram example "Automatic vehicle location" was created using the ConceptDraw PRO diagramming and vector drawing software extended with the Vehicular Networking solution from the Computer and Networks area of ConceptDraw Solution Park.
Vehicular network diagram
Used Solutions
- With Aid Of A Diagram Explain The Various Component Of An ...
- Diagram Explainning Various Component Of An Information
- With The Aid Of Diagram Explain The Various Component Of The
- 4 Level pyramid model diagram - Information systems types | 5 Level ...
- With The Aid Of Diagram Explain The Various Component Of The
- Chart Of Management Information System With Diagram
- What Are The Various Component Unit Of An Information Department
- 4 Level pyramid model diagram - Information systems types | 5 Level ...
- With The Aid Of Diagram Explain Components Units Of Information ...
- Pyramid Diagram | 5 Level pyramid model diagram - Information ...
- Diagrams Of Information Technology
- Relationship Between Business Information System Levels And
- Three Levels Management Information System
- 5 Level pyramid model diagram - Information systems types | Design ...
- Information Technology Diagram
- Diagram Of Information Technology
- Pyramid Diagram | 4 Level pyramid model diagram - Information ...
- Pyramid Diagram | 4 Level pyramid model diagram - Information ...
- 5 Level pyramid model diagram - Information systems types | 4 Level ...
- Diagram Of Various Levels Of An Organisation