A four level pyramid model of different types of Information Systems based on the different levels of hierarchy in an organization. The first level represents transaction processing systems for workers. The second level represents management information systems for middle managers. The third level represents decision support systems for senior menegers. The fourth level represents executive information systems for executives.
"The "classic" view of Information systems found in the textbooks in the 1980s was of a pyramid of systems that reflected the hierarchy of the organization, usually transaction processing systems at the bottom of the pyramid, followed by management information systems, decision support systems, and ending with executive information systems at the top. Although the pyramid model remains useful, since it was first formulated a number of new technologies have been developed and new categories of information systems have emerged, some of which no longer fit easily into the original pyramid model.
Some examples of such systems are:
data warehouses,
enterprise resource planning,
enterprise systems,
expert systems,
search engines,
geographic information system,
global information system,
office automation." [Information systems. Wikipedia]
This diagram was redesigned using the ConceptDraw PRO diagramming and vector drawing software from Wikimedia Commons file Four-Level-Pyramid-model.png. [commons.wikimedia.org/ wiki/ File:Four-Level-Pyramid-model.png]
This file is licensed under the Creative Commons Attribution-Share Alike 3.0 Unported license. [creativecommons.org/ licenses/ by-sa/ 3.0/ deed.en]
The triangle chart example "Information systems types" is included in the Pyramid Diagrams solution from the Marketing area of ConceptDraw Solution Park.
Pyramid diagram

How To Implement Collaborative Project Management


Bar Charts

Picture Graph

 Nature
This solution extends ConceptDraw DIAGRAM software with samples, templates and libraries of vector clipart for drawing the Nature illustrations. Use it to make professional-looking documents, presentations and websites illustrated with color scalable vector c
Business diagrams & Org Charts with ConceptDraw DIAGRAM


Competitor Analysis

Bar Diagrams for Problem Solving. Create manufacturing and economics bar charts with Bar Graphs Solution

 Continent Maps
Continent Maps solution extends ConceptDraw DIAGRAM software with templates, samples and libraries of vector stencils for drawing the thematic maps of continents, state maps of USA and Australia.
 Spatial Infographics
Spatial infographics solution extends ConceptDraw DIAGRAM software with infographic samples, map templates and vector stencils libraries with design elements for drawing spatial information graphics.
 Picture Graphs
Typically, a Picture Graph has very broad usage. They many times used successfully in marketing, management, and manufacturing. The Picture Graphs Solution extends the capabilities of ConceptDraw DIAGRAM with templates, samples, and a library of professionally developed vector stencils for designing Picture Graphs.
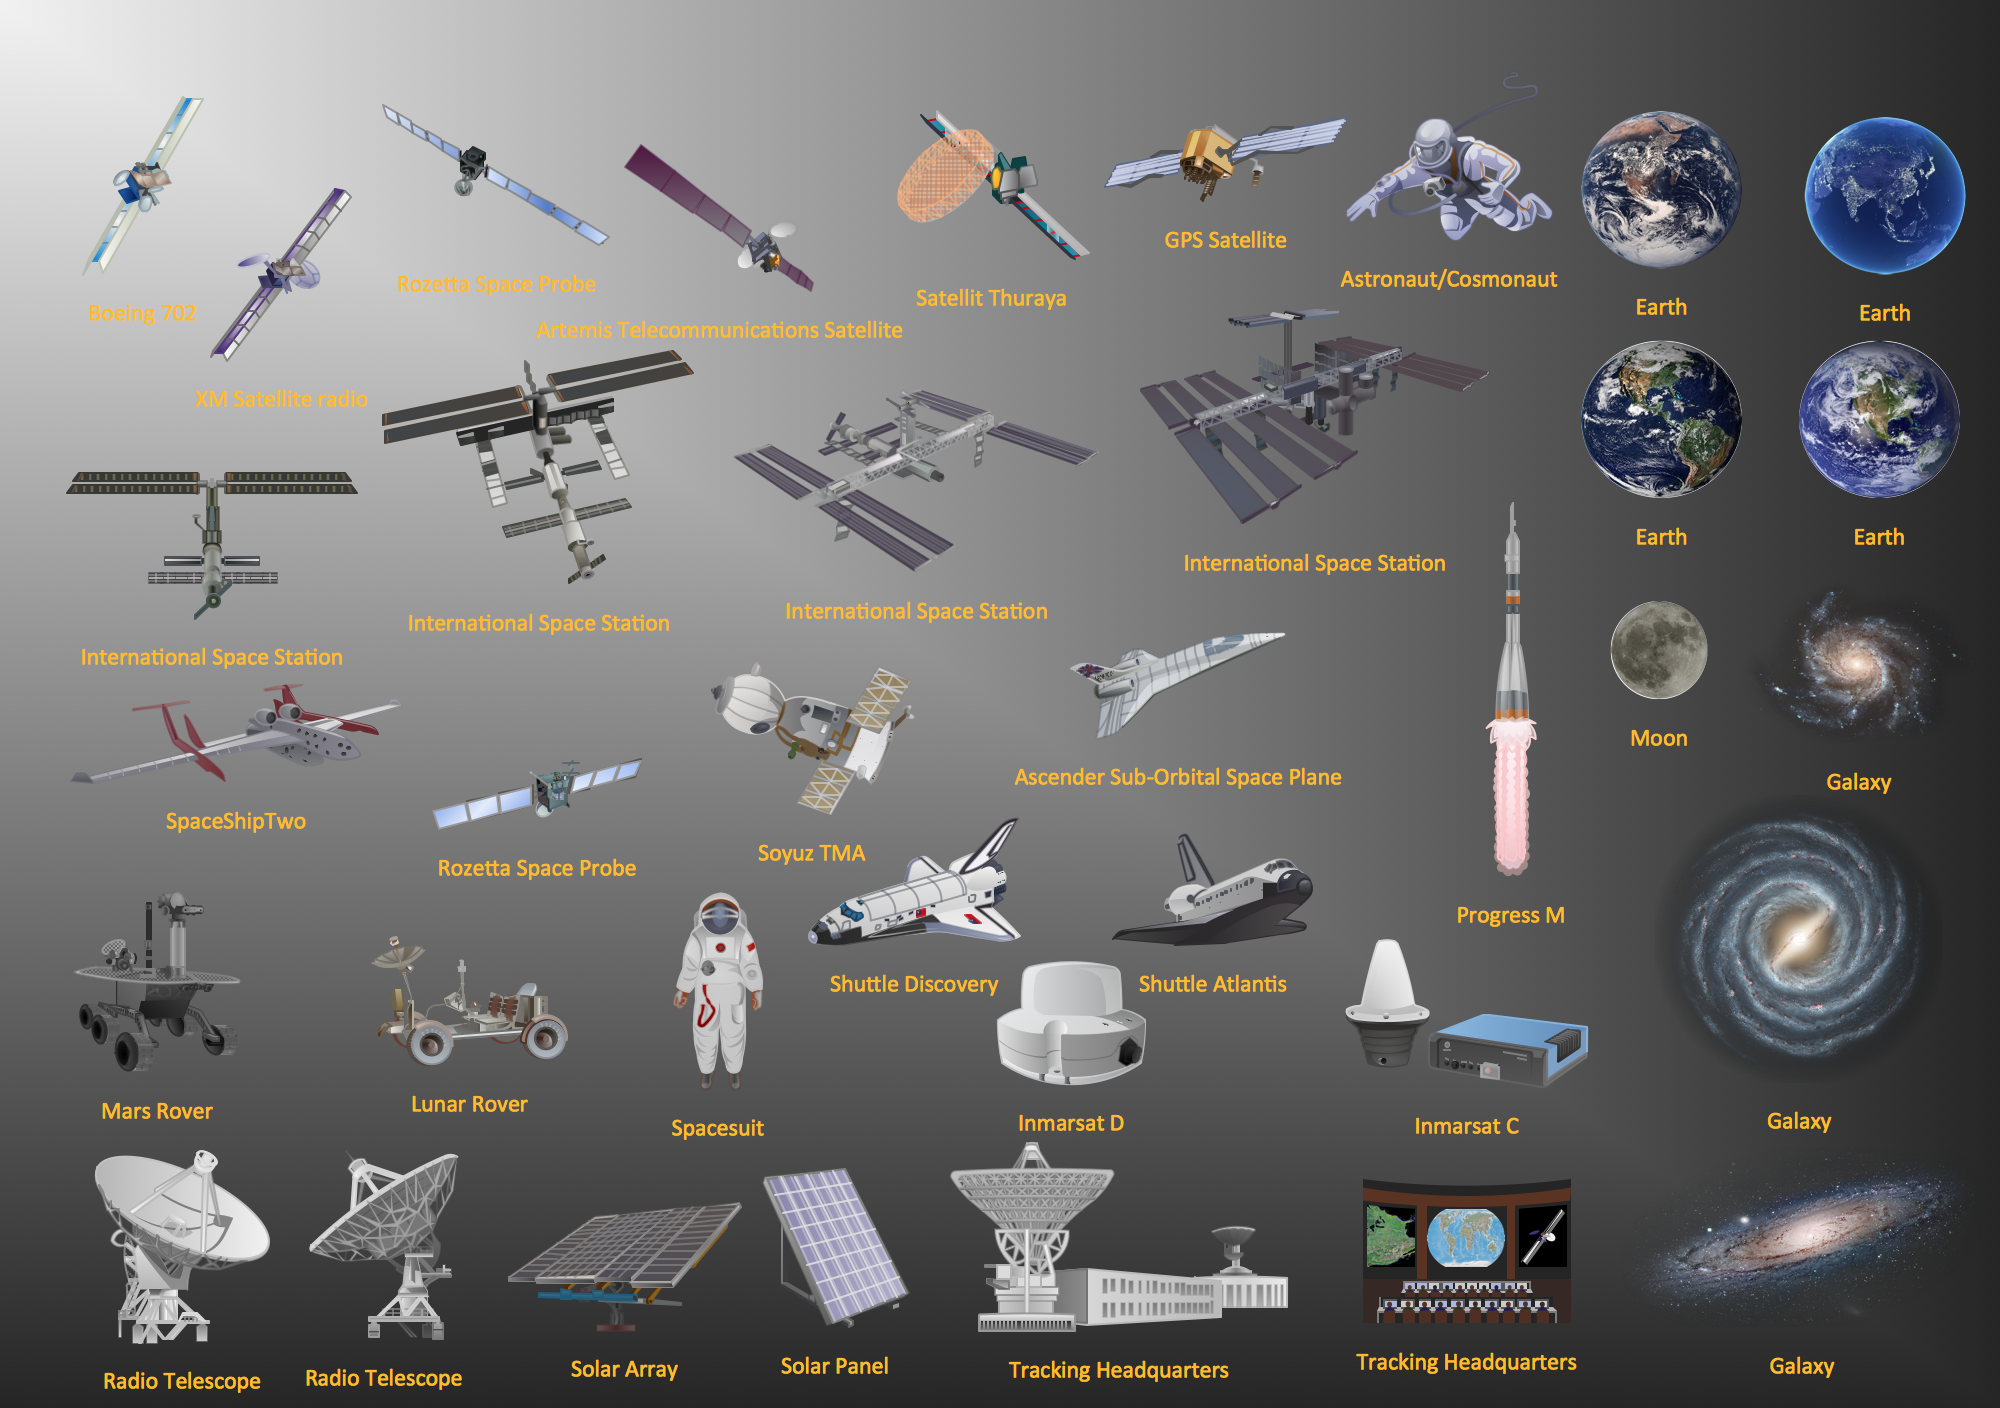
Aerospace - Design Elements
Sales Dashboard

- Pyramid Diagram | Pyramid Diagram | Process Flowchart | Chart Of ...
- 4 Level pyramid model diagram - Information systems types ...
- 4 Level pyramid model diagram - Information systems types ...
- Pyramid Chart Examples | Bar Diagrams for Problem Solving ...
- Pyramid Diagram | Project Management Area | Venn Diagram ...
- Sample Pictorial Chart . Sample Infographics | Pictorial Chart | Line ...
- Gane Sarson Diagram | Universal Diagramming Area | Data ...
- Geography Project Method Of Drawing Pyramid Diagram
- Process Flowchart | Pyramid Diagram | Onion Diagram Maker | With ...
- Pyramid Diagram | Organizational Structure | Process Flowchart ...
- How to Draw a Pyramid Diagram in ConceptDraw PRO | Basic ...
- Information System Pyramid Diagram Example Situation
- Ecosystem goods and services - Segmented pyramid diagram ...
- Pyramid Diagram | Pyramid Diagram | 4 Level pyramid model ...
- Line Chart Examples | Regional population growth from 2010 to ...
- Process Flowchart | Pyramid Diagram and Pyramid Chart | How to ...
- Pyramid Diagram | Organizational culture - Triangle diagram | Cloud ...
- Pyramid Diagram
- How to Create Presentation of Your Project Gantt Chart | Pyramid ...