Bar Diagrams for Problem Solving. Create manufacturing and economics bar charts with Bar Graphs Solution

Pyramid Chart Examples

The 3D vertical bar graph sample shows the Iran internet users per 100 person from 2000 to 2011. It was designed on the base of the Commons Wikimedia file: Iran internet users per 100 person.png.
[commons.wikimedia.org/ wiki/ File:Iran_ internet_ users_ per_ 100_ person.png]
This file is licensed under the Creative Commons Attribution-Share Alike 3.0 Unported license. [creativecommons.org/ licenses/ by-sa/ 3.0/ deed.en]
The data source is World Bank: [data.worldbank.org/ country/ iran-islamic-republic]
"In 1993 Iran became the second country in the Middle East to be connected to the Internet, and since then the government has made significant efforts to improve the nation's ICT infrastructure. Iran's national Internet connectivity infrastructure is based on two major networks: the public switched telephone network (PSTN) and the public data network. The PSTN provides a connection for end-users to Internet service providers (ISPs) over mostly digital lines and supports modem-based connections. The Data Communication Company of Iran (DCI), a subsidiary of TCI, operates the public data network." [Internet in Iran. Wikipedia]
The 3D column chart example "Iran internet users per 100 person" was created using the ConceptDraw PRO diagramming and vector drawing software extended with the Bar Graphs solution from the Graphs and Charts area of ConceptDraw Solution Park.
3D Column chart

Bar Diagrams for Problem Solving. Create economics and financial bar charts with Bar Graphs Solution

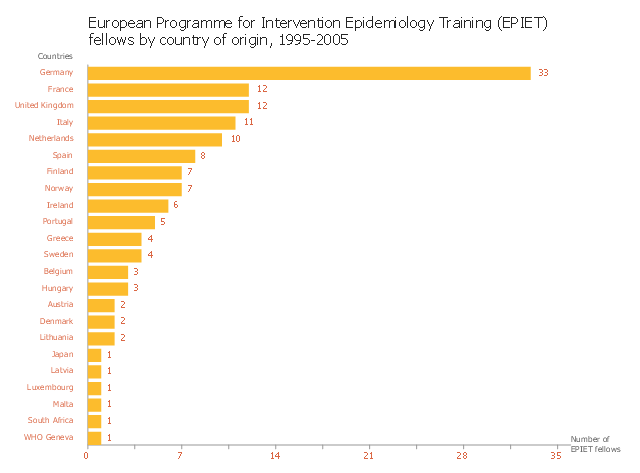
This horizontal bar graph sample shows distribution of European Programme for Intervention Epidemiology Training (EPIET) fellows by country of origin in 1995-2005. It was designed on the base of the bar chart from the website of the Field Epidemiology Manual (FEM) Wiki, the European Programme for Intervention Epidemiology Training (EPIET).
"The simplest bar graph displays data from a table with one variable. Each bar represents one category. Bar graphs can be organised horizontally or vertically. Vertical bars differ from histograms since they are separated by a space. The height of the bar is proportional to the number of events (e.g. cases) in the category, nevertheless the surface is not always proportional to the width of the category on the x-axis (e.g. different width of age groups). If there is a logical order between categories it should be respected. Otherwise categories can be organised along decreasing or increasing values of respective bars. Variables in a bar graph can be discrete (e.g. sex, region, race) or continuous (e.g. age) but organised in categories (e.g. age groups). The x axis does not need to be continuous." [wiki.ecdc.europa.eu/ fem/ w/ wiki/ bar-graphs]
The bar chart example "EPIET fellows by country of origin" was created using the ConceptDraw PRO diagramming and vector drawing software extended with the Bar Graphs solution from the Graphs and Charts area of ConceptDraw Solution Park.
Bar chart
Bar Diagrams for Problem Solving. Create business management bar charts with Bar Graphs Solution

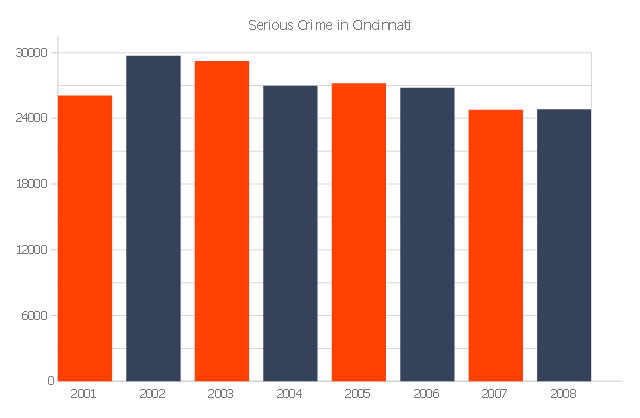
The vertical bar graph sample shows the serious crime number in Cincinnati from 2001 to 2008. It was designed on the base of the Commons Wikimedia file: Cincinnati-Part-1-Crimes.jpg.
[commons.wikimedia.org/ wiki/ File:Cincinnati-Part-1-Crimes.jpg]
"Before the riot of 2001, Cincinnati's overall crime rate was dropping dramatically and had reached its lowest point since 1992. After the riot violent crime increased. Reflecting national trends, crime rates in Cincinnati have dropped in all categories from 2006 to 2010." [Crime in Cincinnati. Wikipedia]
The column chart example "Serious crime in Cincinnati" was created using the ConceptDraw PRO diagramming and vector drawing software extended with the Bar Graphs solution from the Graphs and Charts area of ConceptDraw Solution Park.
Column graph
This picture bar graph sample shows regional population growth from 2010 to 2016. It was designed using data from the Wikipedia article List of continents by population.
[en.wikipedia.org/ wiki/ List_ of_ continents_ by_ population]
"Population geography is a division of human geography. It is the study of the ways in which spatial variations in the distribution, composition, migration, and growth of populations are related to the nature of places. Population geography involves demography in a geographical perspective. It focuses on the characteristics of population distributions that change in a spatial context." [Population geography. Wikipedia]
The pictorial chart example "Regional population growth from 2010 to 2016" was created using the ConceptDraw PRO diagramming and vector drawing software extended with the Picture Graphs solution from the Graphs and Charts area of ConceptDraw Solution Park.
Image chart

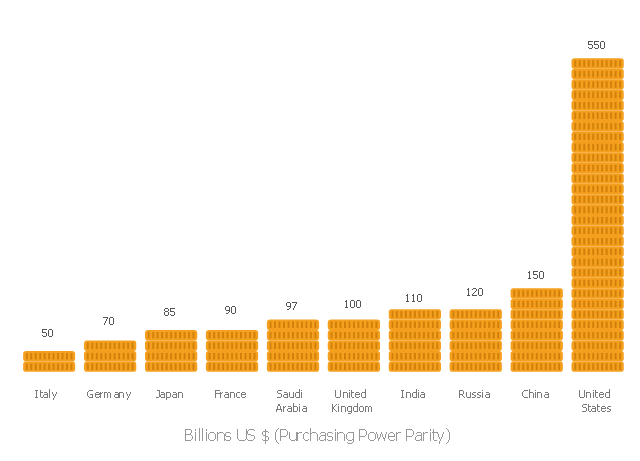
This pictorial bar chart sample shows visual comarison of top ten countries by military expenditure for 2007 by purchasing power parity (PPP) at constant (2005) prices and exchange rates.
It was designed on the base of the Wikimedia Commons file: 2007 top 10 countries by military expenditure PPP.svg.
[commons.wikimedia.org/ wiki/ File:2007_ top_ 10_ countries_ by_ military_ expenditure_ PPP.svg]
"A military budget (or military expenditure), also known as a defense budget, is the amount of financial resources dedicated by an entity (most often a nation or a state), to raising and maintaining an armed forces. Military budgets often reflect how strongly an entity perceives the likelihood of threats against it, or the amount of aggression it wishes to employ. It also gives an idea of how much financing should be provided for the upcoming year. The size of a budget also reflects the entity's ability to fund military activities. Factors include the size of that entity's economy, other financial demands on that entity, and the willingness of that entity's government or people to fund such military activity. Generally excluded from military expenditures is spending on internal law enforcement and disabled veteran rehabilitation." [Military budget. Wikipedia]
The picture bar chart example "2007 top 10 countries by military expenditure PPP" was created using the ConceptDraw PRO diagramming and vector drawing software extended with the Picture Graphs solution from the Graphs and Charts area of ConceptDraw Solution Park.
Picture bar graph
This picture bar graph sample shows the Barrie population growth from 1981 to 2006. It was designed on the base of the Wikimedia Commons file: Barrie Population.jpg.
[commons.wikimedia.org/ wiki/ File:Barrie_ Population.jpg]
"Barrie is a city in Central Ontario, Canada, on the western shore of Lake Simcoe. Although located in Simcoe County, the city is politically independent. Barrie is within the northern part of the Greater Golden Horseshoe, a densely populated and industrialized region of Ontario.
In 2011 census, the city's population was originally reported as 135,711, making it the 34th largest in Canada. The city's 2011 population was subsequently revised to 136,063. The Barrie census metropolitan area (CMA) had a population of 187,013 residents, making it the 21st largest CMA in Canada." [Barrie. Wikipedia]
The pictorial chart example "Barrie population" was created using the ConceptDraw PRO diagramming and vector drawing software extended with the Picture Graphs solution from the Graphs and Charts area of ConceptDraw Solution Park.
Picture bar graph

- Multiple Bar Chart Definition Wikipedia
- Double Bar Graph Wikipedia
- Doughnut Chart Wikipedia
- Bar Graph | Bar Diagrams for Problem Solving. Create ...
- Multiple Bar Graph Wikipedia
- Bar Graph Wikipedia
- Design elements - Composition charts and indicators | Bargraph ...
- Winter Sports | Olympic Medal Bar Graph Wiki
- Winter Sports | Food Court | Joint Bar Graph Wikipedia