This site uses cookies. By continuing to browse the ConceptDraw site you are agreeing to our Use of Site Cookies.

Basic Flowchart Symbols and Meaning

Flowchart Symbols and Meaning - Provides a visual representation of basic flowchart symbols and their proposed use in professional workflow diagram, standard process flow diagram and communicating the structure of a well-developed web site, as well as their correlation in developing on-line instructional projects. See flowchart's symbols by specifics of process flow diagram symbols and workflow diagram symbols.
How to Build a Flowchart

Process Flowchart

ConceptDraw is Professional business process mapping software for making process flow diagram, workflow diagram, general flowcharts and technical illustrations for business documents. It is includes rich examples, templates, process flowchart symbols. ConceptDraw flowchart maker allows you to easier create a process flowchart. Use a variety of drawing tools, smart connectors, flowchart symbols and shape libraries to create flowcharts of complex processes, process flow diagrams, procedures and information exchange.
How To Create a Process Flow Chart (business process modelling techniques)
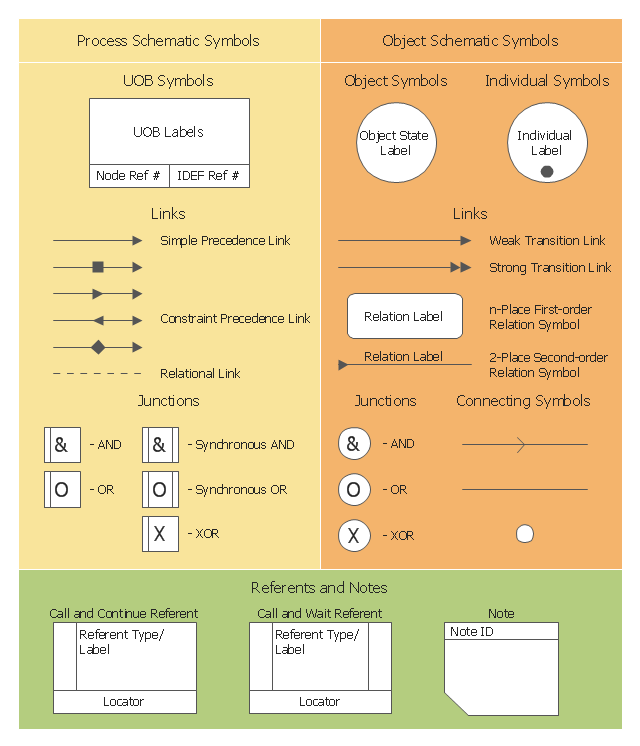
This IDEF3 symbols example was redesigned from the Wikimedia Commons file: 3-01a Symbols Used for IDEF3 Process Description Schematics.jpg.
[commons.wikimedia.org/ wiki/ File:3-01a_ Symbols_ Used_ for_ IDEF3_ Process_ Description_ Schematics.jpg]
"Process schematics tend to be the most familiar and broadly used component of the IDEF3 method. These schematics provide a visualization mechanism for process-centered descriptions of a scenario. The graphical elements that comprise process schematics include Unit of Behavior (UOB) boxes, precedence links, junctions, referents, and notes. Referents and notes are constructs that are common across process and object schematics. Each of the graphical elements used for developing process schematics is presented below, together with discussions of how to formulate more complex statements using those graphical elements. The discussion begins with the most fundamental of these building blocks: the UOB." [IDEF3 Process Description Capture Method Report AL-TR-1995-XXXX. idef.com/ pdf/ Idef3_ fn.pdf]
The sample "Symbols used for IDEF3 process description schematics" was created using the ConceptDraw PRO diagramming and vector drawing software extended with the solution "IDEF Business Process Diagrams" from the area "Business Processes" of ConceptDraw Solution Park.
IDEF3 diagram symbols
IDEF3 diagram symbols, weak transition link, unit of behavior, UOB, temporal indeterminacy marker, synchronous OR junction, synchronous AND junction, strong transition link, simple precedence link, relational link, opposite direction constraint precedence link, note, n-place first-order relation, general constraint precedence link, direction constraint precedence link, connecting line, connecting arrow, call and wait referent, call and continue referent, both directions constraint precedence link, XOR junction, OR junction, OR process, OR junction, IDEF3 object symbol, IDEF3 individual symbol, AND junction, AND process, AND junction, 2-place second-order relation,

Process Flow Diagram Symbols

Chemical and Process Engineering Solution from the Industrial Engineering Area of ConceptDraw Solution Park is a unique tool which contains variety of predesigned process flow diagram symbols for easy creating various Chemical and Process Flow Diagrams in ConceptDraw PRO.

Process Flow Diagram

A Process Flow Diagram (PFD) is a diagram which shows the relationships between the main components in a system. Process Flow Diagrams are widely used by engineers in chemical and process engineering, they allows to indicate the general flow of plant process streams and equipment, helps to design the petroleum refineries, petrochemical and chemical plants, natural gas processing plants, and many other industrial facilities.
ConceptDraw PRO diagramming and vector drawing software extended with powerful tools of Flowcharts Solution from the "Diagrams" Area of ConceptDraw Solution Park is effective for drawing: Process Flow Diagram, Flow Process Diagram, Business Process Flow Diagrams.

Process Diagrams

ConceptDraw PRO diagramming and vector drawing software extended with Chemical and Process Engineering Solution from the Industrial Engineering Area of ConceptDraw Solution Park offers you the set of useful tools for easy drawing various Process Diagrams.

Matrix Organization Structure

Matrix organizational structure is one of the main forms of structures which is actively used by organizations to carry forth the functions of a company visually and effectively.
Now we have ConceptDraw PRO diagramming and vector drawing software extended with 25 Typical Orgcharts solution from the Management area of ConceptDraw Solution Park which will help easy represent matrix organizational structure of any degree of complexity.

Types of Flowcharts

A Flowchart is a graphically representation of the process, algorithm or the step-by-step solution of the problem. There are ten types of Flowcharts. Using the Flowcharts solution from the Diagrams area of ConceptDraw Solution Park you can easy and quickly design the Flowchart of any of these types.
How to Simplify Flow Charting

How to Draw Business Process Diagrams with RapidDraw Interface

Business Process Modeling Notation (BPMN) is a set of standard symbols that allow you to create a graphical view of a business process. The symbols were developed to help users develop standard, unified structure of processes, and any messages shared between these processes.

Cross-Functional Flowchart

Cross-Functional Flowchart - to draw cross functional process maps is by starting with a cross-functional flowchart samples and templates. Easy to draw sample cross functional Process Flow Diagrams. Using a Cross-Functional flowchart is a clear way of showing each team member’s responsibilities and how processes get shared or transferred between different teams and departments.
Use cross-functional flowcharts to show the relationship between a business process and the functional units (such as departments) responsible for that process. To create it use the best flowchart maker of ConceptDraw PRO.
How to Draw a Cross Functional Flowchart using visio alternative ConceptDraw PRO as visio for mac

Business Process Flowchart

Cross-functional (deployment) flowcharts visualize what functional units (people, departments or functional areas) are responsible for the business process operations.
The flowcharts are divided into rows/columns of functional units. Blocks of various shapes represent the process steps, and are placed in rows/columns of the responsible functional units.

How To use House Electrical Plan Software

House Electrical Plan Software for creating great-looking home floor, electrical plan using professional electrical symbols.
You can use many of built-in templates, electrical symbols and electical schemes examples of our House Electrical Diagram Software.
ConceptDraw is a fast way to draw: Electrical circuit diagrams, Schematics, Electrical Wiring, Circuit schematics, Digital circuits, Wiring in buildings, Electrical equipment, House electrical plans, Home cinema, Satellite television, Cable television, Closed-circuit television.
House Electrical Plan Software works across any platform, meaning you never have to worry about compatibility again. ConceptDraw PRO allows you to make electrical circuit diagrams on PC or macOS operating systems.
Create an Electrical Diagram

Steps of Accounting Cycle

The steps of accounting cycle include the processes of identifying, collecting, analyzing documents, recording transactions, classifying, summarizing, posting, and preparing trial balance, making journal entries, closing the books and final reporting financial information of an organization.
Use the ConceptDraw PRO with Accounting Flowcharts Solution to create your own professional Accounting Flowcharts of any complexity quick and easy.

Chemistry Equation Symbols

If you are related with chemistry in you work or education activity, you need often draw various illustrations with chemistry equations. ConceptDraw PRO diagramming and vector drawing software offers you the Chemistry solution from the Science and Education area.
Chemistry solution provides the Chemical Drawings Library with large quantity of vector chemistry equation symbols to help you create professional looking chemistry diagrams quick and easy.

Chemical Engineering

ConceptDraw PRO is a powerful diagramming and vector drawing software. Extended with Chemical and Process Engineering Solution from the Industrial Engineering Area of ConceptDraw Solution Park, it became the best Chemical Engineering software.